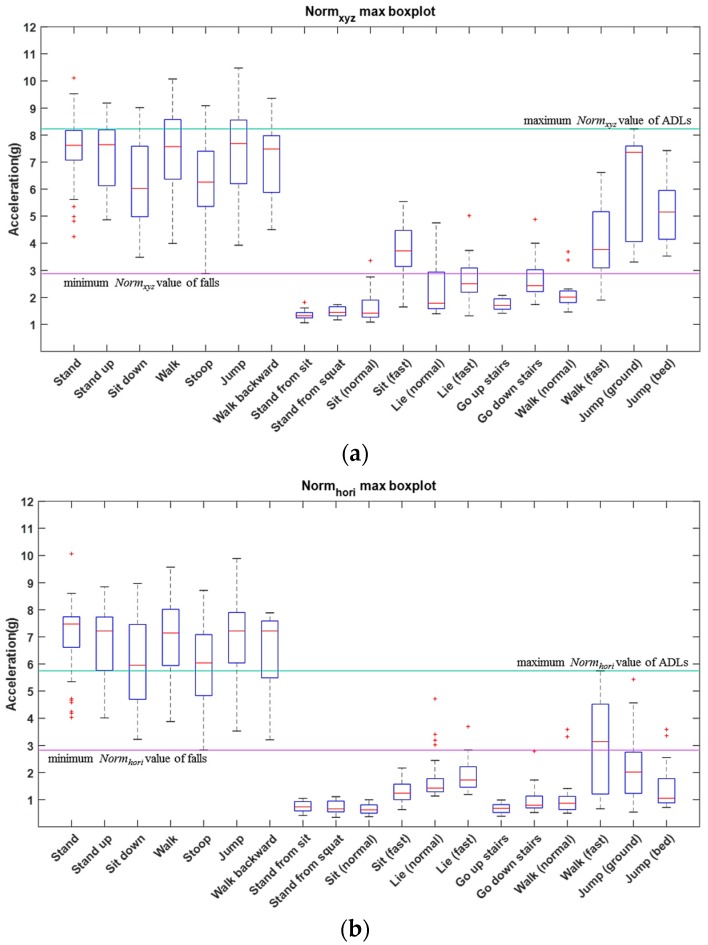
Figure 3.
The illustration of the Normxyz and Normhori distribution of falls and ADLs. The left seven activities are falls and the right 12 activities are ADLs. The green line is determined by the maximum Normxyz value of ADLs. The purple line is determined by the minimum Normxyz value of falls. (a) The boxplot of maximum Normxyz values for falls and ADLs; (b) The boxplot of maximum Normhori values for falls and ADLs.

