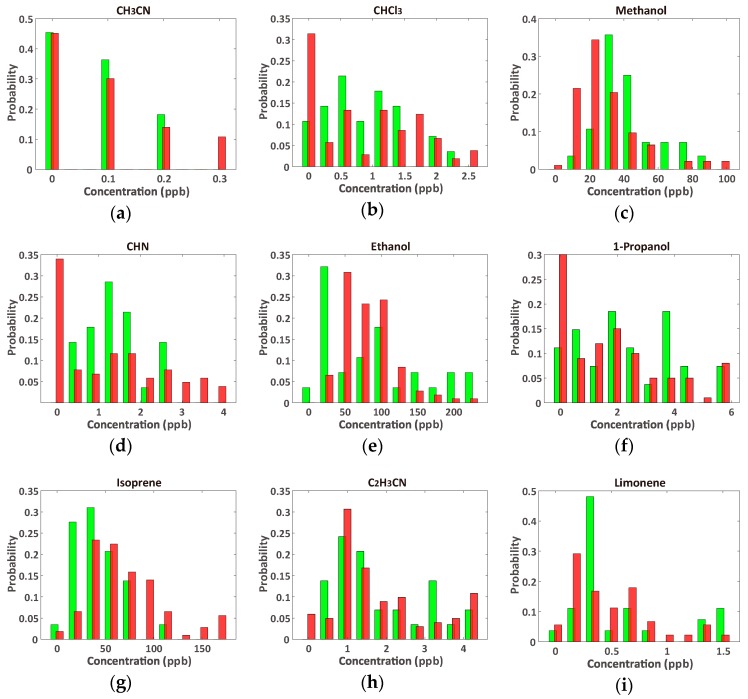
Figure 2.
Comparison of VOC concentration distributions from lung cancer (red, n = 107) and healthy (green, n = 29) controls’ breath; (a) CH3CN; (b) CHCl3; (c) methanol; (d) CHN; (e) ethanol; (f) 1-propanol; (g) isoprene; (h) C2H3CN; and (i) limonene. The VOCs in (a–e) show significant differences between samples, while those in (f–i) do not show significant differences (Table 1). The distributions of the remaining 11 VOCs are shown in the Supplementary Information (Figure S1).

