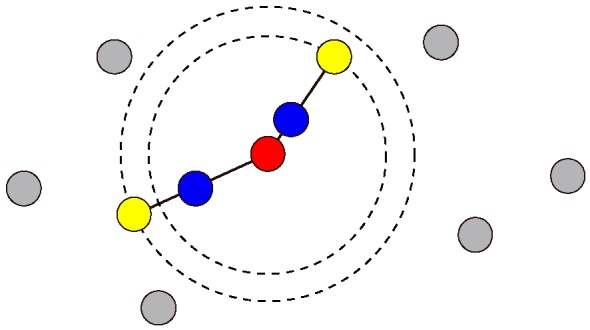
Figure 3.

Schematic illustrating the oversampling technique to obtain the same number of healthy control samples to that of the lung cancer patients. After one sample (red) is randomly chosen, two samples (blue) are randomly interpolated on the lines between the chosen sample and the two nearest samples (yellow).
