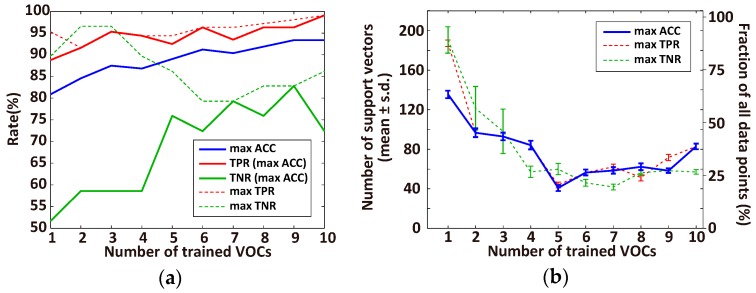
Figure 6.
Dependency of the performance of SVM diagnosis on the number of trained VOCs of the data set (lung cancer patients, n = 107; healthy individuals, n = 29, oversampling healthy samples, n = 78). (a) Best accuracy (ACC, blue line) with the corresponding true positive rate (TPR, solid red line) and true negative rate (TNR, solid green line) within all combinations of each number of trained VOCs (from 1 to 10). The dashed red and green lines represent the best TPR and TNR, respectively; (b) The number of support vectors that are used in the classifier in (a) for the best ACC (blue), TPR (red), and TNR (green). Left and right y-axes represent the actual number of data points and fraction of all data points, respectively.

