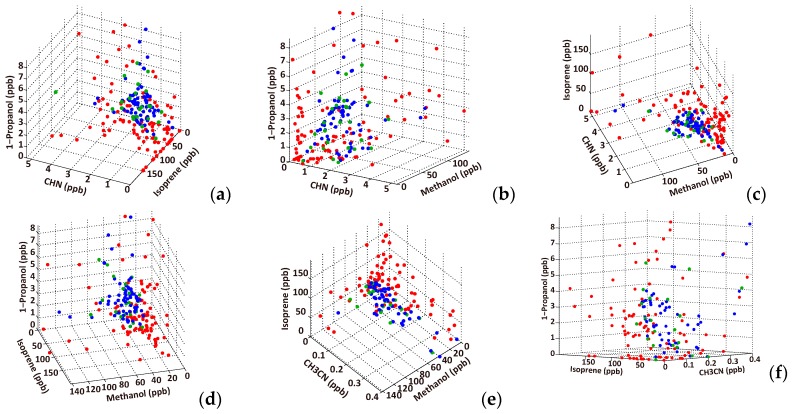
Figure 7.
VOC distributions on a 3D representation for the list of top accuracy combinations in Table 5. CHN, isoprene, 1-propanol (a); CHN, methanol, 1-propanol (b); CHN, methanol, isoprene (c); isoprene, methanol, 1-propanol (d); CH3CN, methanol, isoprene (e); and isoprene, CH3CN, 1-propanol (f). The red and green circles represent lung cancer patients and healthy controls, respectively, and the blue circles indicate the oversampling data. The oversampling data are more widely spread than the original healthy samples in this range because some of the healthy samples exist outside of the axis range.

