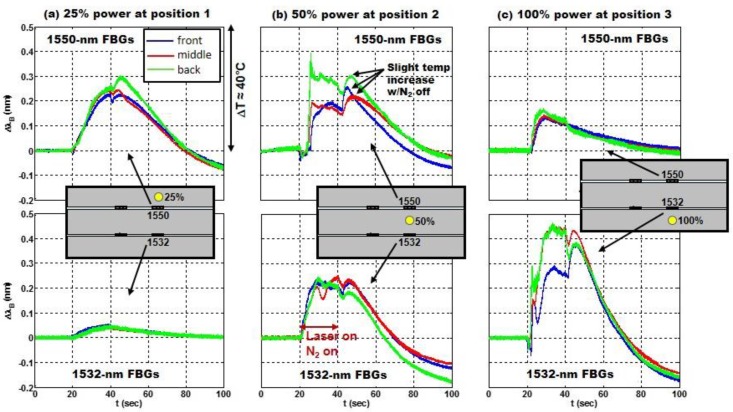
Figure 11.
(a–c) The shift vs. time for the FBGs with nominal Bragg wavelengths of 1550 nm and 1532 nm during laser strikes at positions 1–3, respectively, in Figure 10. The laser (and N2 gas) turned on at 20 s and off at 40 s. The specimen was oriented with air flow from right to left in strikes 1–3. The location of the strike, the relative laser power level and the corresponding FBG are shown in the inset for each pair of graphs.

