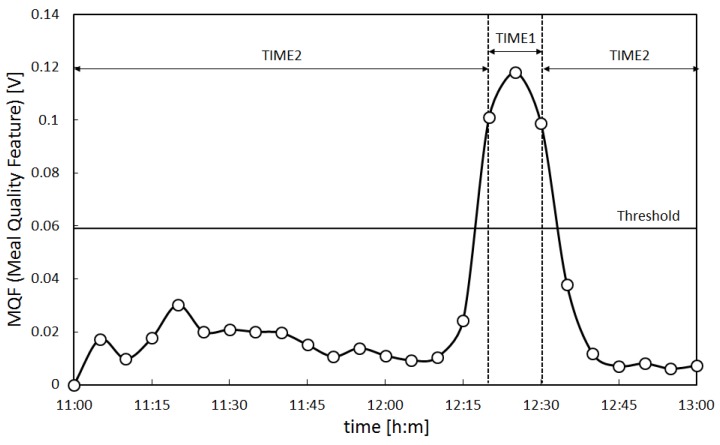
Figure 8.
Meal quality feature of subject A. The Meal Quality Feature (MQF) of subject A calculated using the meal time estimation algorithm is presented in the figure. The vertical axis in the figure shows the MQF in volts (V), while the horizontal axis shows the time (11:00 to 13:00) in hours and minutes (h:m). The time during which the MQF is above the threshold is TIME1, while the time during which the MQF is below the threshold is TIME2. TIME1 is the estimated meal time.

