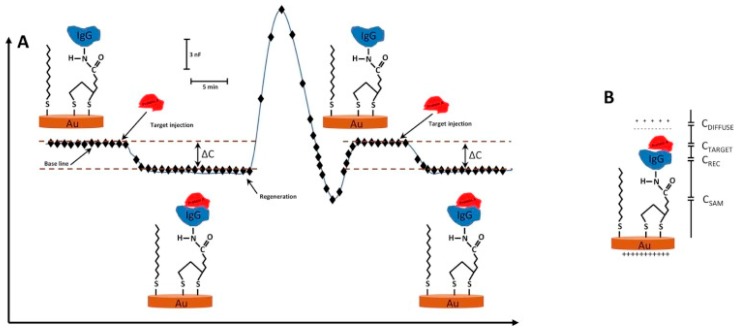
Figure 1.
(A) Schematic diagram showing the change in capacitance (ΔC) as a function of time when the analyte (IgG) interacts with the receptor molecule (Protein A) immobilized on the surface of the electrode. Subsequent rise in signal is due to the dissociation after the injection of the regeneration solution. In an ideal sensorgram, the baseline should turn back to the original level after regeneration of the surface; (B) Immobilization of the receptor molecule on the transducer surface via a self-assembled monolayer (SAM) of alkylthiols. When the target molecule interacts with the receptor, this creates a double layer of counter ions around the gold transducer which results in a change in the capacitance. (Reproduced from Reference [8] with permission).

