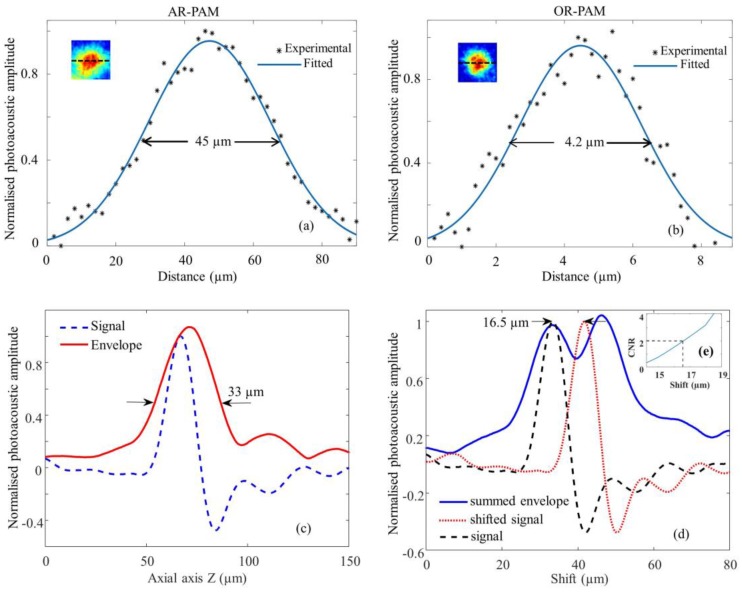
Figure 2.
Spatial resolution test of the AR-OR-PAM system: Lateral resolution estimated by imaging gold nanoparticles ~100 nm diameter, Black (*) dots: photoacoustic signal; blue line: Gaussian-fitted curve; (a) AR-PAM; (b) OR-PAM. The inset shows the representative AR-PAM image in (a) and OR-PAM image in (b) of the single gold nanoparticle; (c) Photoacoustic axial spread profile and its envelope; (d) Simulated photoacoustic shift-and-sum A-line signals. The dashed line and dotted line indicate two photoacoustic signals 16.5 µm apart. The solid line indicates the summed envelope of the two shifted signals; (e) Contrast-to-noise ratio (CNR) versus the shift distance between the two signals.

