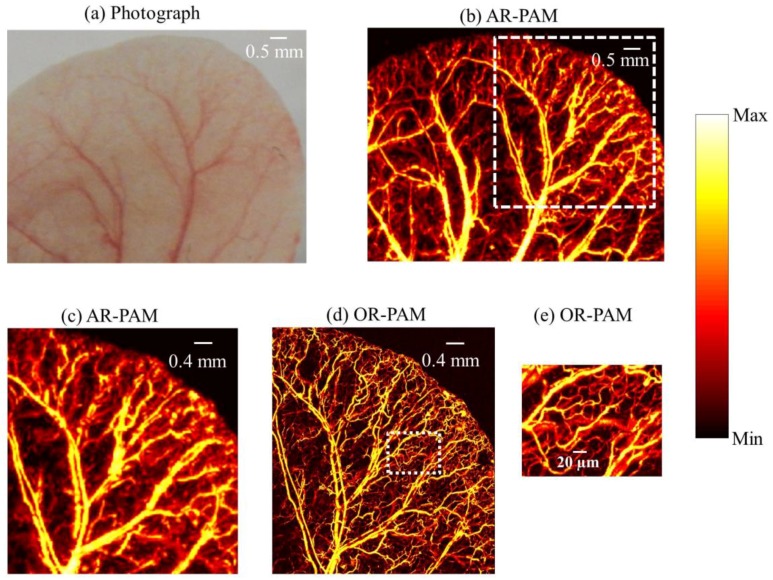
Figure 5.
In vivo photoacoustic image of mouse ear: (a) photograph of the mouse ear vasculature; (b) AR-PAM image; (c) close up of the region of interest (ROI) in (b) as shown by white dash line; (d) OR-PAM image of the same ROI; (e) close up of the region of interest in (d) as shown by white dotted line.

