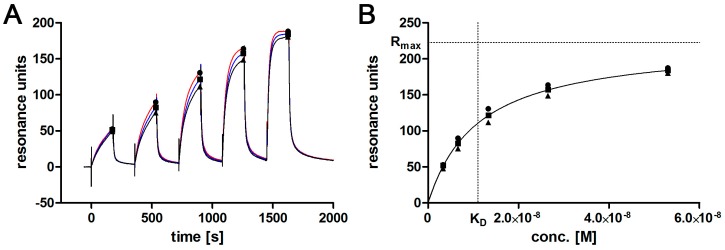
Figure 2.
Single cycle kinetics of l-selectin LE-His in cell culture supernatant using SPR. (A) triplicate of the kinetic titration is shown. Symbols mark binding levels that will be plotted against the respective concentrations shown in (B) binding levels are plotted against corresponding concentrations. Extrapolated Rmax and respective KD at Rmax/2 are marked by dotted lines.

