
Extended Data Figure 2. Trajectories of TBV for males (left) and females (right).
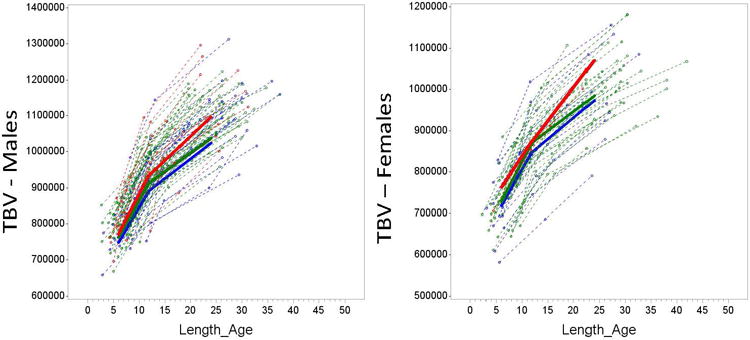
For illustrative purposes, we provide plots for Total Brain Volume (TBV) for males and females from the same sample. Figure 1 shows the longitudinal trajectories of total brain volume (TBV) from 6 to 24 months for the three groups examined, with males and females displayed separately. The trajectory of TBV for males only among the three groups is similar to the pattern we see in the full sample (Main Text, Figure 1). The female only HR-ASD group is quite small (n=2) which makes the pattern of trajectory difficult to interpret. These figures support the general similarity of the findings in the combined sample and the male-only sample. Key: red = HR-ASD, green = HR-neg, blue = LR. Total brain volume (TBV) shown in mm3. Length_age refers to the age corrected by length (body size).