
Figure 2. Cortical regions showing significant expansion in surface area from 6-12 months in HR-ASD.
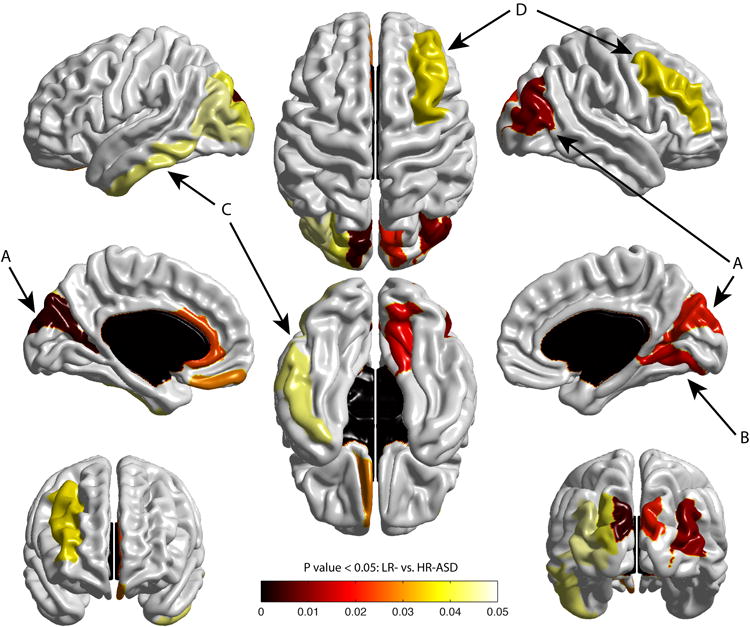
Figure 2 displays the map of significant group differences in surface area from 6 to 12 months. Exploratory analyses were conducted with a 78 region of interest surface map (see Supplementary Information), using an adaptive Hochberg method of p <0.05. The colored areas show the group effect for the HR-ASD versus LR subjects. Compared to the LR group, the HR-ASD group had significant expansion in cortical surface area in the left/right middle occipital gyrus and right cuneus (A), right lingual gyrus (B), and to a lesser extent the left inferior temporal gyrus (C), and middle frontal gyrus (D). HR-ASD, n = 34; LR, n = 84.