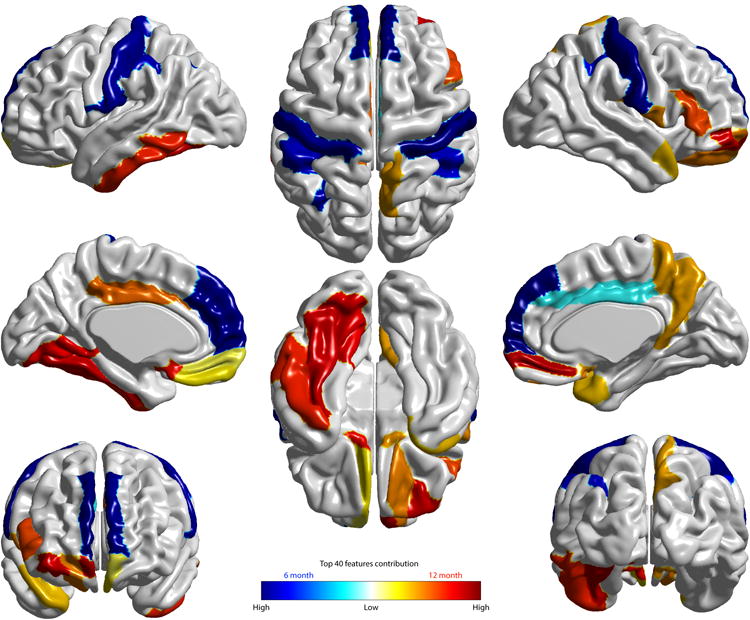
Figure 3. Visualization of cortical regions with surface area measures among the top 40 features contributing to the deep learning (DL) dimensionality reduction.

The cortical regions whose surface area measures are among these top 40 features obtained from the non-linear deep learning (DL) approach are visualized. The top 10 DL features observed include: surface area at 6 months in the right and left superior frontal gyrus, post-central gyrus, and inferior parietal gyri, and ICV at 6 months. These features produced by the DL approach are highly consistent with those observed using an alternative approach (linear sparse learning) (Extended Data, Figure 1). Two tables listing the top 40 features from the DL approach and sparse learning are provided in Supplementary Information (Tables 2 and 3).
