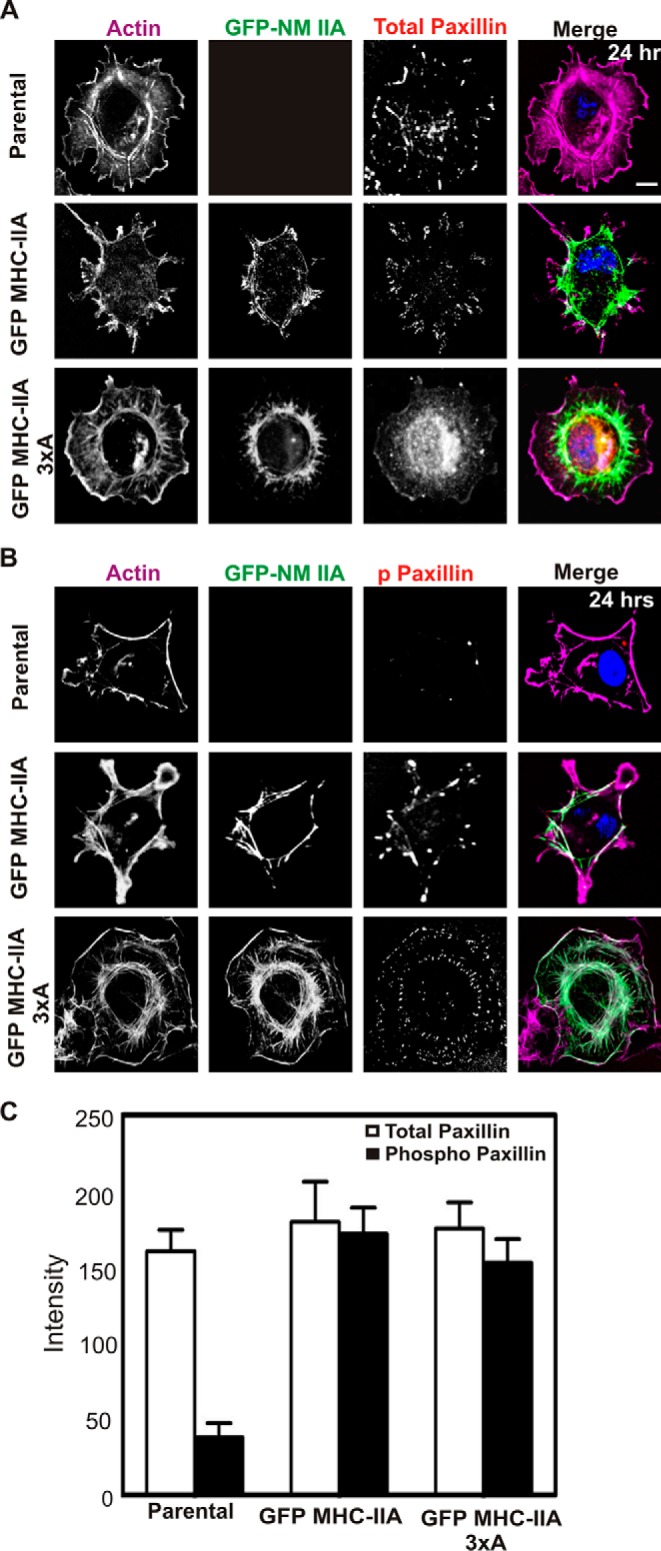
FIGURE 3.

Localization of GFP-NMIIA phosphorylation site mutants and paxillin phosphorylation at 24-h plating in COS-7 cells. Parental COS-7 cells and COS-7 cells expressing GFP MHC-IIA or GFP MHC-IIA 3×A were plated for 24 h on collagen I-coated glass, fixed, and stained with Alexa-568-phalloidin to visualize F-actin (violet) and DAPI to visualize nuclei (blue) and immunostained with anti-paxillin antibody (A) or anti-phospho-Tyr-118 paxillin antibody (B) (red). Scale bar, 20 μm. C, for A and B, each image represents five 0.2-μm confocal Z-sections, collapsed, from the attached base of the cell. Signal intensity in this section of the cell was quantitated and reported as arbitrary units. Data are plotted as mean ± S.D. n = 6 cells for each line, and data were pooled from experiments performed on two different dates. At this 24-h plating time, phospho-paxillin signal for GFP MHC IIA and GFP MHC-IIA 3×A displayed no statistically significant difference.
