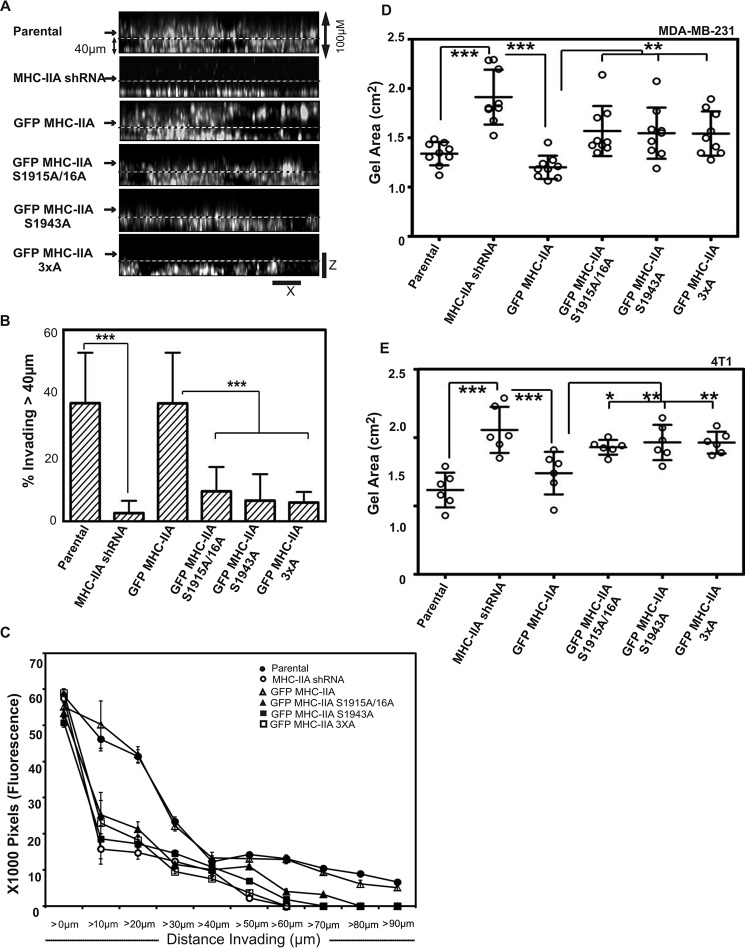
FIGURE 5.
NMIIA phosphorylation is critical for 3D invasion and contraction. A, invasion into 3D collagen gels. The indicated cell lines were plated on a glass bottom dish, overlaid with 3 mg/ml collagen I, and then incubated with complete medium for 18 h, at which point samples were fixed and stained with DAPI. Confocal Z-stacks were collected to quantify migration vertically into the gel. Shown are XZ images for sample Z-stacks from each cell line. B, to quantify invasion, the percent of DAPI signal greater than 40 μm away from the coverslip was measured for 24 fields of view from three independent experiments performed on different dates. Data are plotted as mean ± S.D. C, invasion into collagen gels was quantified in 10-μm increments for each cell line as fine resolution metric for invasion. Fluorescence intensity (DAPI) in each subsequent 10-μm Z slice is reported on the y axis. Data were derived from the same set of experiments described in B. D and E, collagen gel contraction assays. Scattered graph of MDA-MB-231 (D) and 4T1 (E) cells showing collagen gel size for parental cells, MHC-IIA shRNA cells, and MHC-IIA shRNA cells expressing the indicated GFP MHC-IIA construct, after 24 h of embedding cells in 2 mg/ml collagen. MDA-MB-231 cells and 4T1 cells lines, n = 9 and n = 6, respectively, two independent experiments were performed on different days. Data are plotted as mean ± S.D. Statistical analyses were performed with one-way analysis of variance (Dunnett's multiple comparison test).

