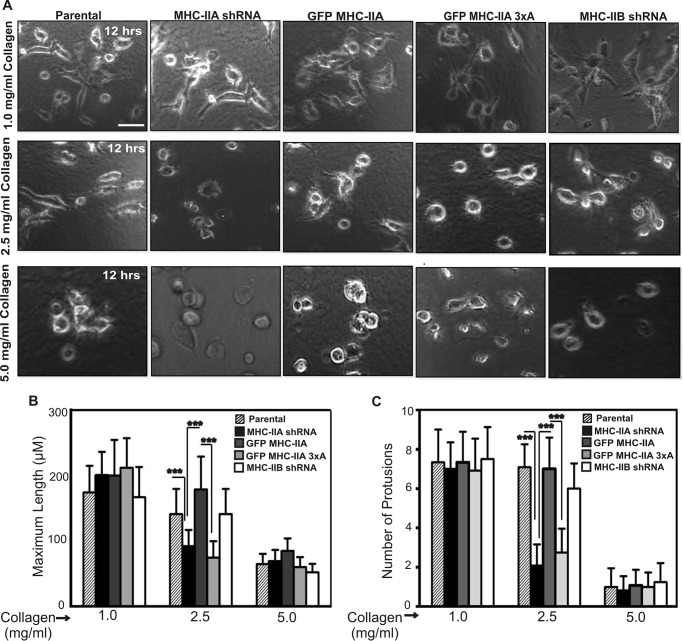
FIGURE 7.
Role of NMIIA and NMIIA phosphorylation in 3D protrusion formation depends upon the stiffness of the extracellular environment. A, time-lapse imaging of the indicated 4T1 cell lines embedded in collagen-I gels of either 1.0, 2.5, or 5 mg/ml was performed. Representative images 12 h post-plating are shown. Scale bar, 50 μm. B and C, maximum cell length (B) and number of protrusions/3 h (C) for all cell populations at each collagen concentration was quantitated. Data are plotted as mean ± S.D. *** indicates p < 0.001 representing significant increase or decrease, n = 30 and n = 12 cells for each cell type in (B and C), respectively. Individual measures were made on data sets from three independent dates.

