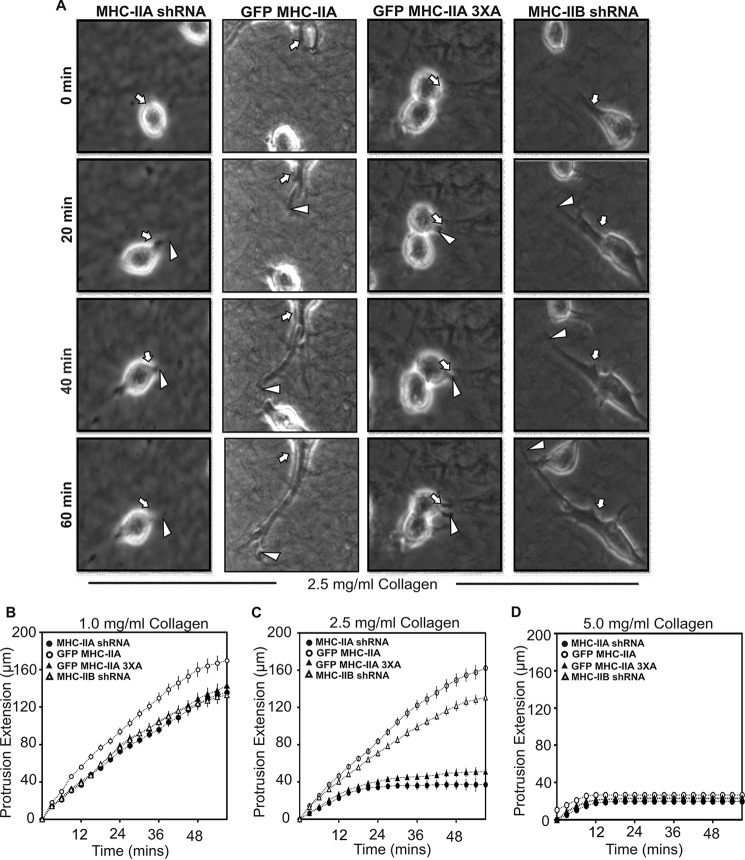
FIGURE 8.
Rate of protrusion elongation depends upon the stiffness of the extracellular environment. A, time lapse images of protrusion extension by indicated cell lines in 2.5 mg/ml collagen. Protrusion lengths were measured from consecutive images to quantify extension rates. White arrows indicate position of initial protrusion event, and white arrowheads indicate tip of the protrusion at sequential time points. Protrusions are much more visible if one views the supplemental time-lapse movies. B–D, protrusion rates were quantitated by measuring length of each protrusion every 3 min for 60 min from cells embedded in collagen gels of 1.0 mg/ml (B), 2.5 mg/ml (C), or 5 mg/ml (D). Data are plotted as mean ± S.D. n = 12 cells for each condition; data were pooled from experiments performed on three different dates.

