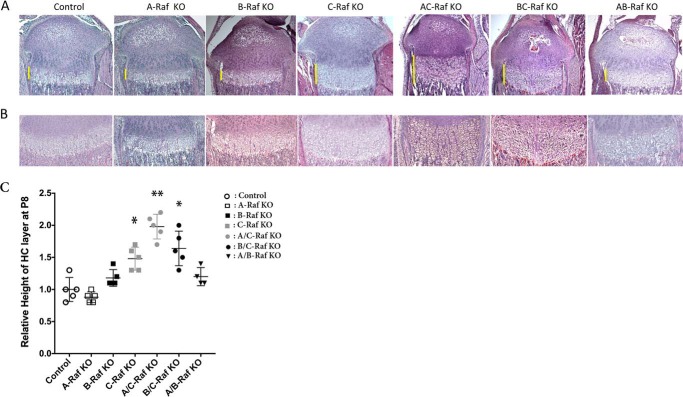
FIGURE 1.
Growth plate histology of single and compound Raf mutants. A and B, H&E staining was performed on tibiae of P8 mice: control, A-Raf KO (A-Raf−/y), B-Raf KO (B-Raff/f;Col2Cre), C-Raf KO (C-Raff/f;Col2Cre), A/C-Raf KO (A-Raf−/y;C-Raff/f;Col2Cre), B/C-Raf KO (B-Raff/f;Col2Cre; C-Raff/f;Col2Cre), and A/B-Raf KO (A-Raf−/y;B-Raff/f;Col2Cre). Data are representative of 4–5 mice per genotype. Bars indicate the extent of the hypertrophic chondrocyte layer. A, ×4 magnification. B, ×10 magnification. C, relative height of the hypertrophic chondrocyte layer of the growth plate in Raf KO versus control. Data are representative of 4–5 mice per genotype. Error bars indicate ± S.E. *, p < 0.02 versus control, **, p = 0.0023 versus C-Raf KO. HC, hypertrophic chondrocytes.

