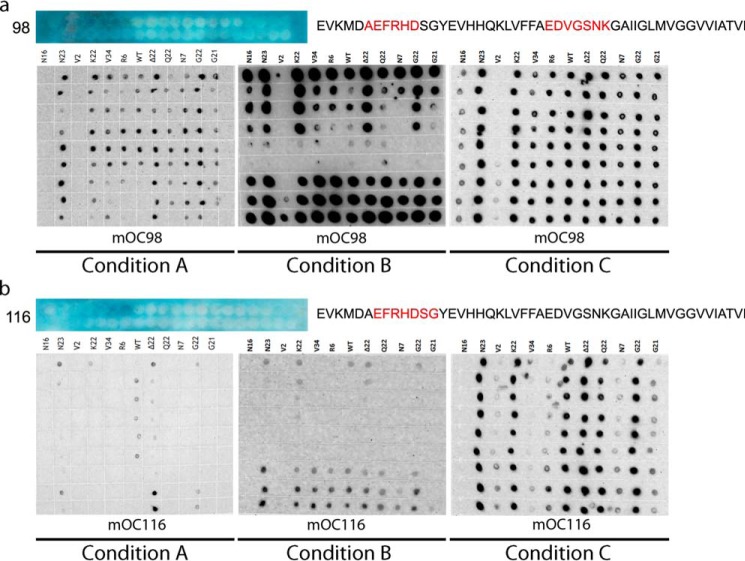
FIGURE 6.
Relationship between location of FAD mutation and antibody epitope and reactivity. Dot blotting results for Aβ40 and 11 Aβ variants associated with FAD aggregated under conditions A–C probed with antibody mOC98 (a) and mOC116 (b), along with epitope mapping data for each of the antibodies. Blue depicts the results of a SPOT epitope mapping experiment. Each of the blue panels depicts 40 spots containing peptides C-terminally bound to a cellulose membrane. The peptides are consecutive 10-amino acid-long segments of the Aβ sequence beginning at position −3 (top left corner). The blue color indicates antibody reactivity with a particular spot. The interpretation of the epitope mapping study is to the right of the results, with the apparent epitope highlighted in red. In this assay, a large number of consecutive reactive spots indicates a shorter epitope, as there are a smaller number of amino acids common to the reactive spots. Conversely, a small number of consecutive reactive spots indicates a longer epitope, as the longer epitope would only be contained within a smaller number of spots.

