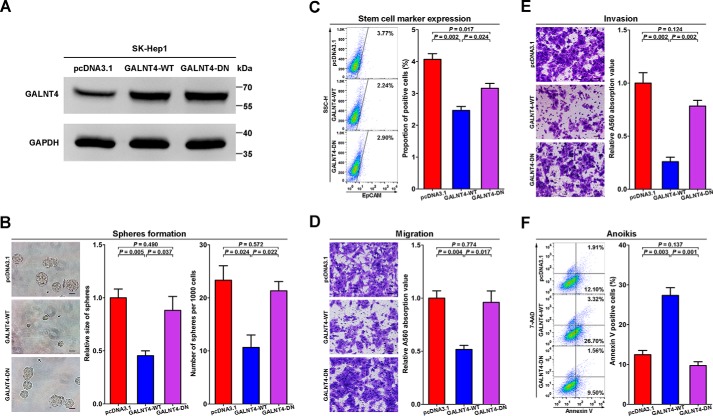
FIGURE 4.
GALNT4 attenuates cellular migration, invasion, and stemness and induces anoikis of HCC cells in vitro, but the glycosyltransferase-dead mutant failed to be competent to exert these effects. A, overexpression of GALNT4-WT and GALNT4-DN in SK-Hep1 were confirmed by Western blot. B, representative micrograph of tumor spheres formed by stably transfected cells after 7 days of culture and corresponding quantification of sphere size and numbers. Sphere size is determined by its diameter. Scale bar, 50 μm. C, expression of EpCAM was measured by FACS after 48 h of sphere-forming culture. D, representative images of migration assay and corresponding quantification determined by A560 absorbance. Scale bar, 50 μm. E, representative images of invasion assay and corresponding quantification determined by A560 absorbance. Scale bar, 50 μm. F, representative flow cytometry of anoikis assays and corresponding quantification. Positive populations were analyzed by Annexin V/7-AAD staining. Considering that the sphere-forming assay needs to last for 7 days, stably overexpressed cells were used in this part. Transiently transfected cells were used in other analysis. All data are from three independent experiments. Error bars, S.E.

