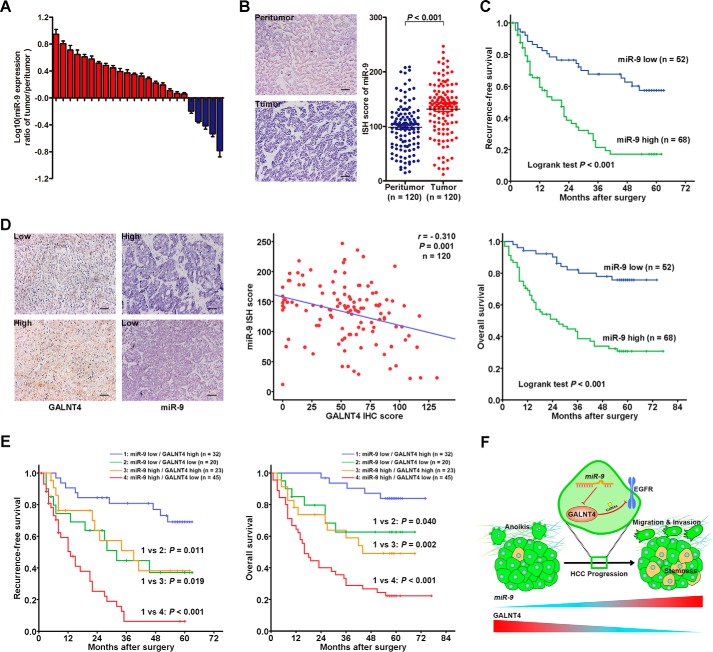
FIGURE 8.
Inverse correlated expression pattern of miR-9 and GALNT4 contributes to refine the risk stratification of patients with HCC. A, miR-9 expression was detected in 24 pairs of primary HCC tumors and corresponding peritumor tissues by qRT-PCR. Analysis was performed in triplicate and normalized to the internal control, U6 small nuclear RNA. The y axis depicts log10(-fold change of miR-9 expression). Tissue specimens were collected from the same set of patients as in Fig. 1A. All data are from three independent experiments. B, representative ISH images of miR-9 expression in tumor and matched peritumor tissues of HCC patients from the same set of specimens as in Fig. 1 (left) and scatter plots for ISH scores of miR-9 expression in tumor and matched peritumor tissues. Scale bar, 50 μm (original magnification, ×200). C, Kaplan-Meier survival analysis of HCC patients for RFS and OS according to the expression of miR-9 (high expression subgroup, n = 68; low expression subgroup, n = 52). p value was calculated by log rank test. D, representative images of ISH staining with miR-9 and IHC staining with GALNT4 in tumor tissues (left). Scale bar, 50 μm. The correlation between miR-9 and GALNT4 expression was assessed by Spearman correlation test (right). E, subgroup analysis of HCC cases according to the expression profile of miR-9 and GALNT4 by the Kaplan-Meier method. p value was calculated by log rank test. F, proposed model of the role of the miR-9/GALNT4/EGFR axis for migration, invasion, anoikis resistance, and stemness properties in HCC cells during HCC progression.

