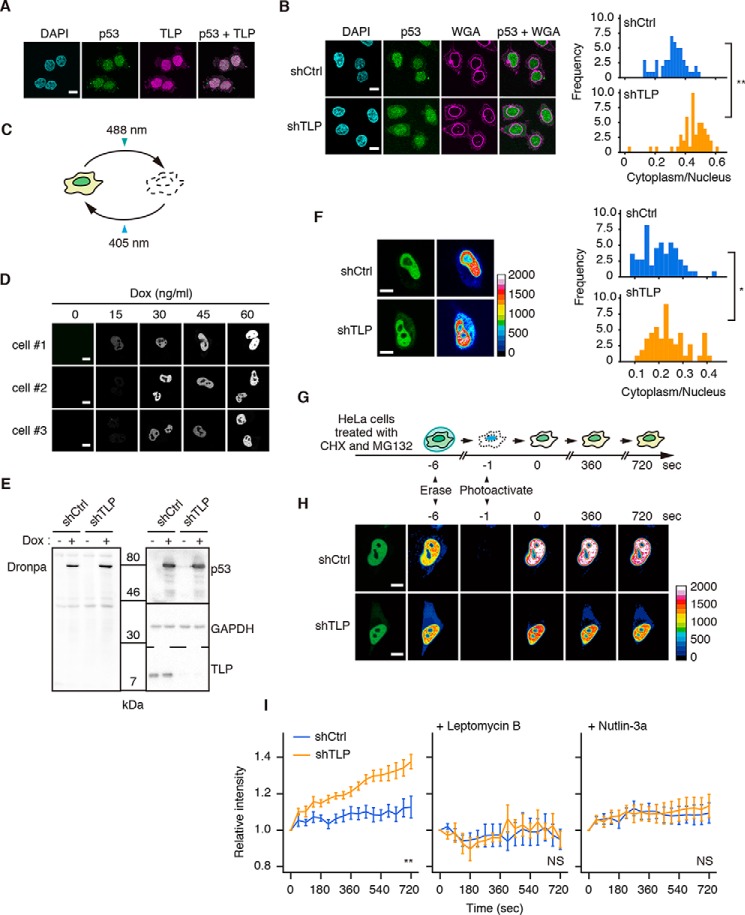
FIGURE 5.
TLP suppresses nuclear export of p53. A, HCT116 cells were transfected with FH-TLP, and cells were subjected to immunofluorescence staining with anti-p53 (p53) and anti-FLAG (TLP) antibodies. Scale bar: 10 μm. Nuclei were stained with DAPI. B, TLP-depleted HCT116 cells were treated with 5 μm MG132 for 30 min and subjected to immunofluorescence staining with anti-p53 antibody. Cell membranes were detected with Alexa Fluor 555-conjugated wheat germ agglutinin (WGA). Left, fluorescence was observed using a confocal microscope. Right, histogram of p53 intensity in the cytoplasm/that in the nucleus of each cell (n = 55). **, p < 0.01 (Welch's t test). C, schematic representations of the property of Dronpa. Intense irradiation at 488 nm changed Dronpa to a dark form, and weak irradiation at 405 nm restored it to a bright form. D, HeLa cells were transfected with pEF1α-TET3G and pTRE3G-p53-Dronpa, and the expression of p53-Dronpa under control of the Tet-On system was induced using the indicated amount of Dox. The p53-Dronpa signal in each cell was scanned using a confocal microscope. Three independent HeLa cell batches (cells #1–3) were analyzed. E, shTLP-expressing HeLa cells were transfected with pEF1α-TET3G and pTRE3G-p53-Dronpa, and the expression of p53-Dronpa was induced using 30 ng/ml of Dox. Cells were treated with CHX and MG132, and p53-Dronpa was detected by Western blot. F, shTLP-expressing HeLa cells were transfected with pEF1α-TET3G and pTRE3G-p53-Dronpa, and p53-Dronpa was induced by treatment with Dox. Left, 24 h after transfection the p53-Dronpa signal in each cell was scanned using a confocal microscope. Right, histogram of p53 intensity in the cytoplasm/in the nucleus of each cell (n = 60). Scale bar, 20 μm. *, p = 0.013 (Welch's t test). G, schematic representation of p53-Dronpa detection method for its nuclear export. H, shTLP-expressing HeLa cells were transfected with pEF1α-TET3G and pTRE3G-p53-Dronpa, and p53-Dronpa was induced by treatment with Dox. Cells were treated with CHX and MG132, and the p53-Dronpa signal in each cell was observed using a confocal microscope. Scale bar: 20 μm. I, left, time courses of the nuclear efflux of p53-Dronpa in TLP-depleted HeLa cells. In negative control experiments, leptomycin B (middle) and Nutlin-3a (right) were added to cells in addition to CHX and MG132. The closest time point after the reactivation was defined as time 0, and the increment of the intensity of cytoplasmic p53-Dronpa from time 0 was calculated (mean ± S.E.) and displayed as the relative intensity. At least eight cells were measured per experiment. **, p < 0.01; NS, not significant (two-way repeated measures analysis of variance).

