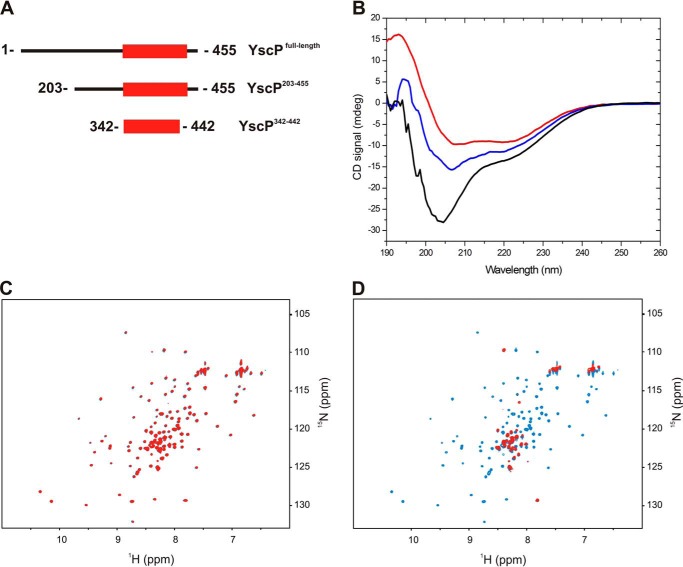
FIGURE 2.
YscP domain architecture and its YscUC-interacting segment. A, schematic representation of YscP and its truncated variants that were used in this study. B, far UV-CD spectra of YscP (black), YscP(342–442) (red), and YscP(203–455) (blue). All proteins were used at a concentration of 10 μm in 5 mm sodium phosphate, 30 mm NaCl, 1 mm DTT (pH 7.4) at 20 °C. mdeg, millidegrees. C, overlay of two-dimensional 1H-15N HSQC spectra of free 15N-labeled YscUC (blue) and 15N-labeled YscUC mixed with unlabeled YscP(342–442) (red). D, overlay of two-dimensional 1H-15N HSQC spectra of free 15N-labeled YscUC alone (blue) and mixed with unlabeled YscP(203–455) (red).

