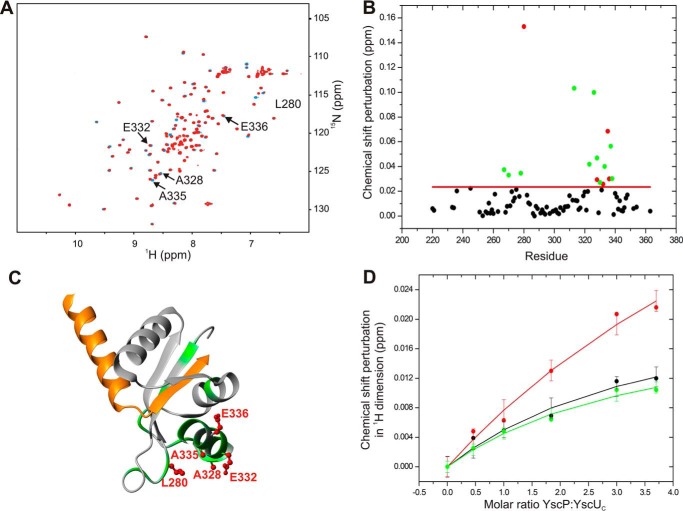
FIGURE 3.
NMR-based identification of the YscP binding surface on YscUC. A, overlay of the two-dimensional 1H-15N HSQC spectra of free 15N-enriched YscUC (100 μm) before (blue) and after addition of YscP (400 μm) (red). The spectra were acquired in PBS buffer containing 1 mm TCEP at 37 °C. Solvent-exposed residues that exhibit significant chemical shift perturbations upon YscP addition are marked with arrows. B, compounded chemical shift perturbations (ppm) between free 15N-labeled YscUC and 15N-labeled YscUC in complex with unlabeled YscP were calculated using Equation 1 and plotted against the YscUC primary sequence. The threshold value used to define a significant chemical shift perturbation is indicated by the red line, and residues exhibiting significant shifts are represented by green dots except for solvent-accessible amino acid residues with significant chemical shift perturbations (Leu280, Ala328, Glu332, Ala335, and Glu336), which are represented by red dots. C, display of the YscP binding interface on YscUC. The structure of YscUC illustrates the positions of the residues with significant chemical shifts (green) and the solvent-exposed residues with significant chemical shift perturbations (indicated as red ball and sticks). D, determination of the Kd value for the YscP-YscUC interaction obtained by using Equation 2 to fit the changes in the chemical shifts of the methyl groups of YscUC induced by YscP addition. Plots for three peaks in the methyl region are shown in black, red, and green, respectively. The error bars represent S.D.

