FIGURE 5.
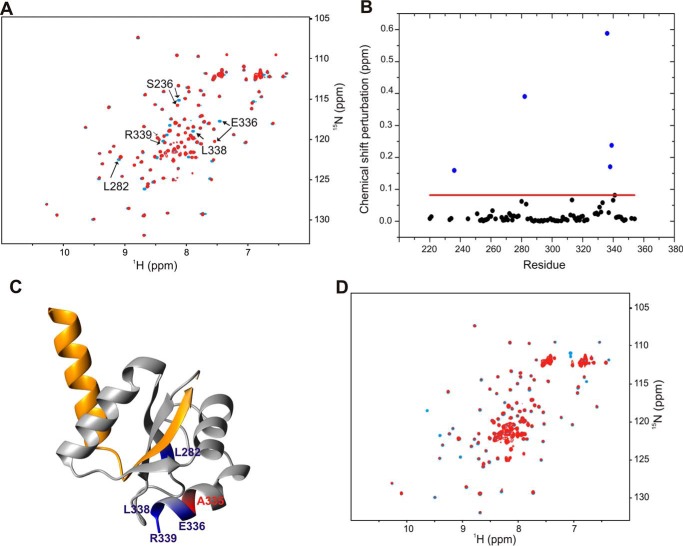
Disruption of YscP binding by the A335N replacement in YscUC. A, overlay of two-dimensional 1H-15N HSQC spectra of 15N-labeled YscUCWT (blue) and YscUCA335N (red) at concentrations of 100 μm. The buffer consisted of PBS and 1 mm TCEP at 37 °C. Solvent-exposed residues that exhibit significant chemical shift perturbations upon mutation are indicated with arrows. B, compounded chemical shift perturbations (ppm) between 15N-labeled YscUCWT and 15N-labeled YscUCA335N calculated by Equation 1 and plotted against the YscU residue number. The threshold value used to define significant chemical shift changes is indicated by the red line. The residues with the largest chemical shift perturbations (Ser236, Leu282, Glu336, Leu338, and Arg339) cluster around the mutation site and are shown in blue; position 335 is shown in red on the YscUC crystal structure in C. D, overlay of two-dimensional 1H-15N HSQC spectra of 15N-labeled YscUCA335N at a concentration of 100 μm alone before (blue) and after addition of unlabeled YscP (red) at a molar ratio of 1:4 in PBS.

