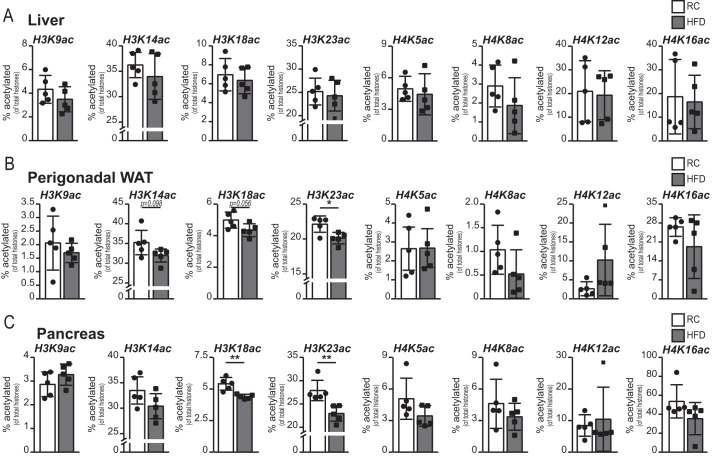
FIGURE 4.
Specific histone acetylation marks are suppressed by HFD in WAT and pancreas. A–C, histones were extracted from the liver (A), perigonadal WAT (B), and pancreas (C) of mice fed either RC (white columns) or HFD (gray columns) for 4 weeks (n = 5/group). Values are expressed as percent of each lysine that is acetylated. Data are graphed as mean ± S.D., with data from individual animals represented as dots. Statistical significance was assessed by two-tailed t test (*, p < 0.05; **, p < 0.01; or as indicated).

