FIGURE 4.
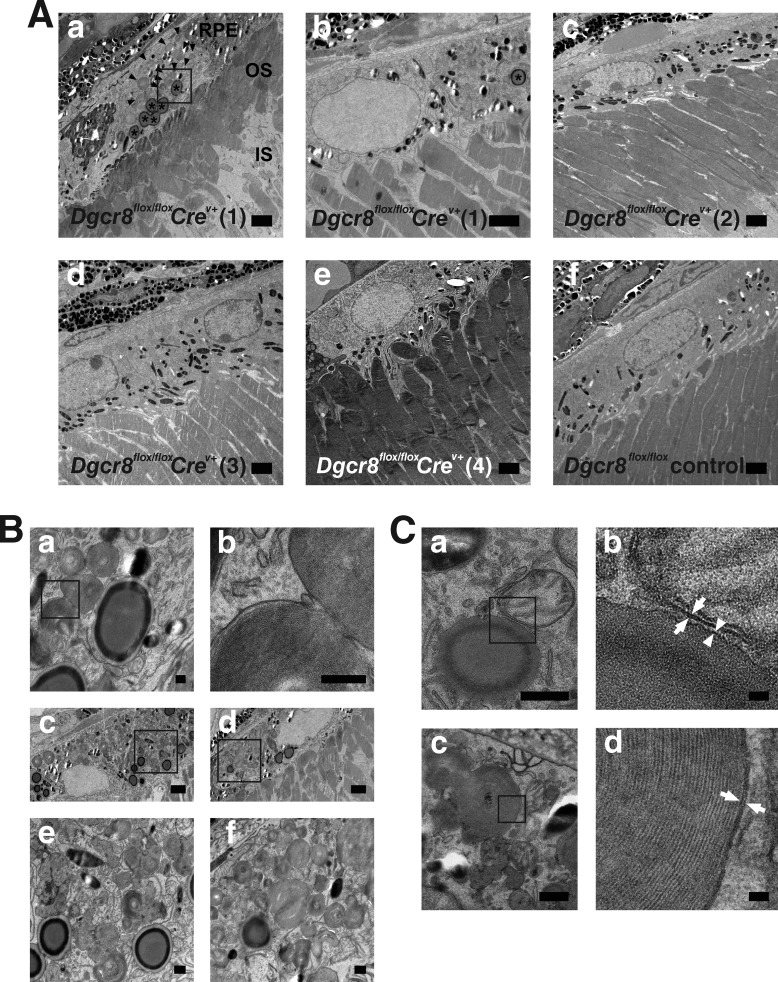
Shortening of OS and accumulation of phagosomes and lipid droplet-like structures in the RPE of Dgcr8flox/floxCrev+ mice. TEM retinal images from 5-week-old Dgcr8flox/floxCrev+ and Dgcr8flox/flox control mice are shown. TEM images of four Dgcr8flox/floxCrev+ mice (Dgcr8flox/floxCrev+ (1), Dgcr8flox/floxCrev+ (2), Dgcr8flox/floxCrev+ (3), and Dgcr8flox/floxCrev+ (4)) and one Dgcr8flox/flox control mouse are shown. A, variability of phenotypic outcome was noted for different regions of the same retinal sections from one Dgcr8flox/floxCrev+ mouse (Dgcr8flox/floxCrev+ (1)): shortened OSs and accumulation of phagosomes and lipid droplet-like structures in adjacent RPE (asterisks in A (a)) or normal OSs and RPE (A (b)). Phagosomes containing OSs are indicated by arrowheads in A (a). Lipid droplet-like structures designated by asterisks in A (a and b) contained homogeneous electron-dense material without any membrane structures and featured a more electron-dense ring at the rim. Plastic sections prepared from three of four Dgcr8flox/floxCrev+ mice (Dgcr8flox/floxCrev+ (2) to (4)) showed normal OSs and RPE (A (c–e)). Plastic sections prepared from Dgcr8flox/flox control mice also revealed normal OSs and RPE (A (c–f)). B, higher magnification images of phagosomes and lipid droplet-like structures in a Dgcr8flox/floxCrev+ (1) mouse indicated by the box in A (a) are shown in B (a) and with even more enhancement in B (b). Remnant disc membrane structures are evident. B (c–f), other examples of accumulated phagosomes and lipid droplet-like structures from Dgcr8flox/floxCrev+ mice (1). Higher magnification images of phagosomes and lipid droplet-like structures indicated by boxes in B, c and d, are shown in B, e and f, respectively. C, higher magnification images of lipid droplet-like structures and phagosomes from Dgcr8flox/floxCrev+ mice (1). C (a), a lipid droplet-like structure and a mitochondrion in the RPE. Higher magnification images of the rim region of lipid droplet-like structure indicated by a box in C (a) are shown in C (b). The rim of lipid droplet-like structure evidenced a single layer (arrow). In contrast, outer membrane of mitochondria showed double layers (arrow). C (c), Phagosomes in the RPE. Higher magnification images of the phagosome membrane indicated by the box in C (c) are shown in C (d). The phagosome membrane showed double layers (arrow). IS, inner segment. Scale bars, 2 μm (A and B (c) and B (d)), 200 nm (B (a and b)), 400 nm (B (e and f) and (C (a and c)), and 40 nm (C (b and d)).

