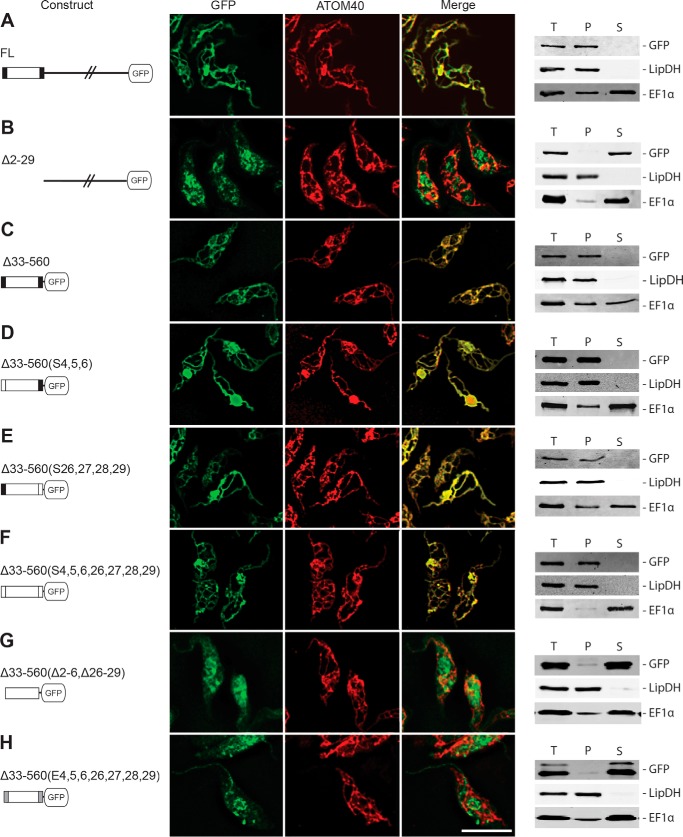
FIGURE 4.
Characterization of the targeting signal in POMP10. IF analysis of the indicated POMP10-GFP fusion proteins (A–H, left columns) in procyclic forms of transgenic T. brucei (A–H, middle column). Samples were probed for GFP and the mitochondrial marker ATOM40, respectively. An overlap of both signals is also shown (Merge). Bar, 10 μm. Crude digitonin-based cell fractionation analysis (A–H, right column) of cell lines expressing the indicated POMP10-GFP fusion proteins. Total cellular extract (T), crude mitochondrial fraction (P), and digitonin-extracted cytosolic fraction (S) and shown. LipDH and EF1α served as mitochondrial and cytosolic markers, respectively. FL, full-length.

