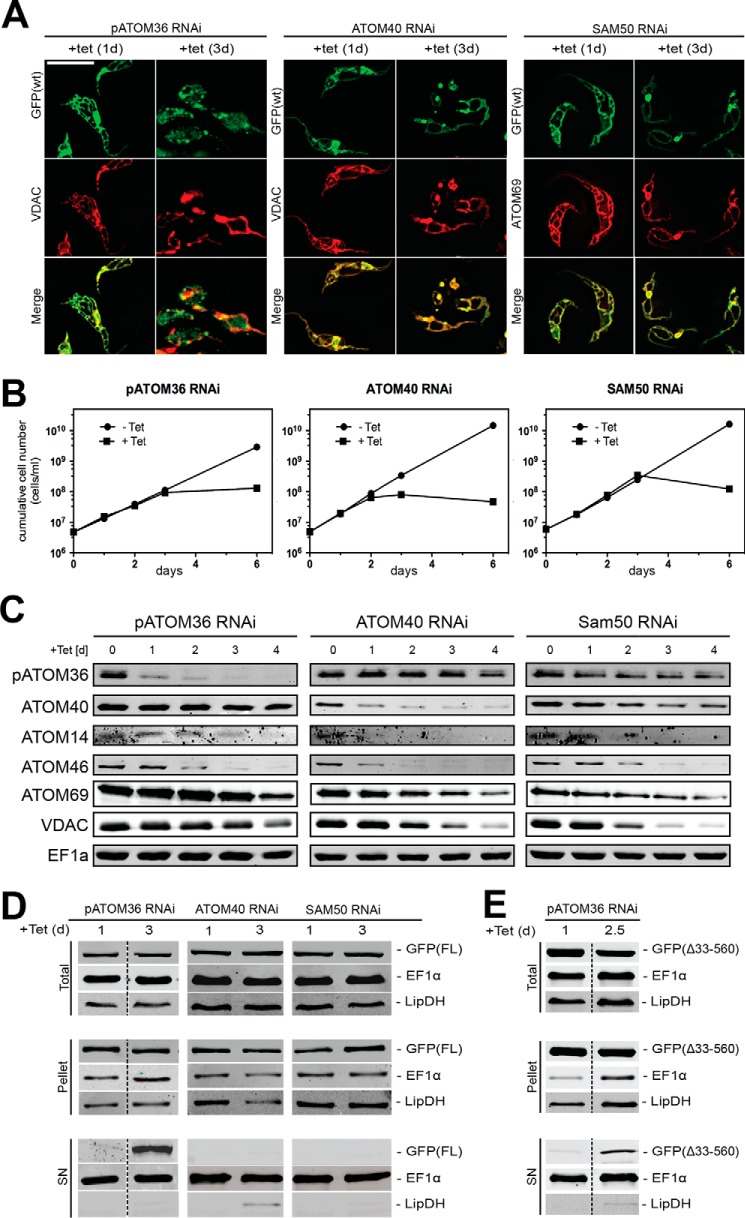
FIGURE 7.
In vivo biogenesis of POMP10 depends on pATOM36. A, IF analysis of full-length POMP10 that is C-terminally tagged with GFP (GFP(FL): green) and mitochondrial marker proteins (VDAC and ATOM69: red) in tetracycline (tet)-inducible pATOM36 (left panels), ATOM40 (middle panels), and SAM50 (right panels) RNAi cell lines. Time of induction in days (d) is indicated at the top. Bar, 10 μm. B, growth curves of tetracycline-inducible pATOM36 (left panels), ATOM40 (middle panels), and SAM50 (right panels) RNAi cell lines that co-express full-length POMP10-GFP and that were used in A. C, equal cell equivalents of the same RNAi cell lines shown in A (left panel, pATOM36; middle panel, ATOM40; right panel, SAM50) were analyzed for the presence or absence of pATOM36, ATOM40, ATOM14, ATOM46, ATOM69, VDAC, and cytosolic EF1a using immunoblots. Time of RNAi induction is indicated at the top of each panel. D, crude digitonin-based cell fractionation analysis of the same cell lines shown in A and B. Total cellular extract (top panels), crude mitochondrial fraction (pellet, middle panels), and digitonin-extracted cytosolic fraction (SN, bottom panels) were probed for POMP10-GFP (GFP(FL)). LipDH and EF1α served as the mitochondrial and cytosolic markers, respectively. E, same as D, but a tetracycline-inducible pATOM36 RNAi cell line that co-expresses the POMP10 fusion protein in which the transmembrane domain including the positively charged flanking residues was directly fused to the GFP was analyzed.

