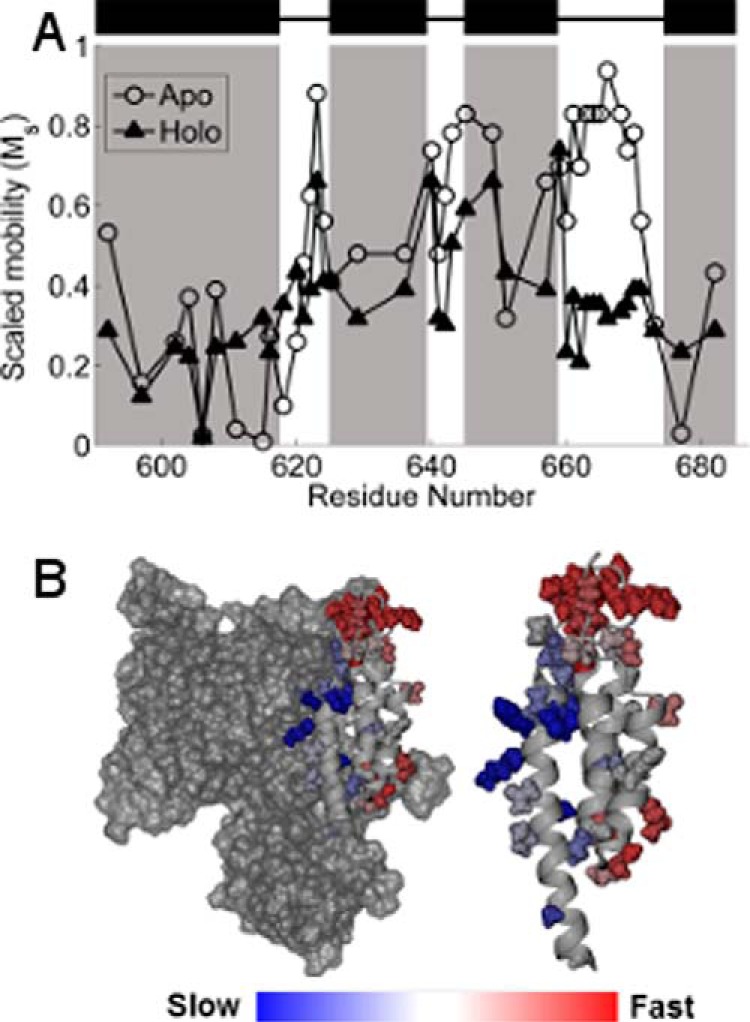
FIGURE 3.

A, scaled mobility of the R1 side chain. Open circles indicate the apo state, and filled triangles indicate the holo state. Higher values of Ms indicate greater mobility of the R1 side chain. Black rectangles and shaded regions indicate helices in the C-terminal domain as defined by the crystal structures (13, 14). B, Ms in the apo state mapped onto the crystal structure of ExoU. Color changes from blue to red indicate increasing motion of the R1 side chain. Left, the catalytic domain is shown in surface rendering. Right, the isolated C-terminal four-helix bundle.
