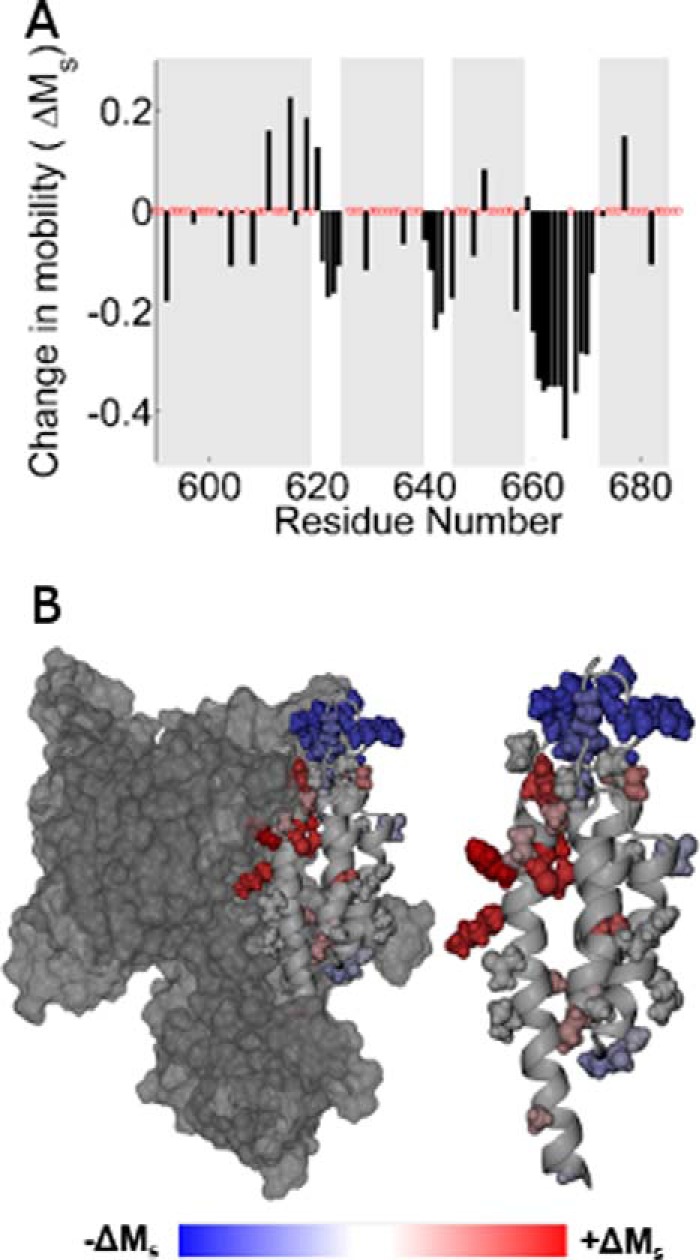
FIGURE 4.

A, histogram showing the change in scaled mobility, Ms(apo) − Ms(holo), as a function of the labeling site. Clusters of negative values indicating decreased mobility in the holo state correspond to the three interhelical loops. B, the change in Ms mapped onto the ExoU crystal structure. Sites that increased motion upon adoption of the holo state are shown in red, and sites that exhibit decreased motion are shown in blue.
