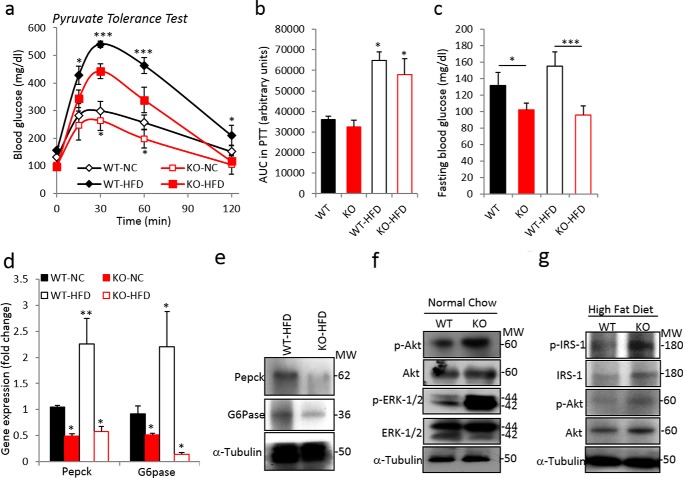
FIGURE 4.
Smad3 deficiency suppresses hepatic gluconeogenesis and enhances hepatic insulin sensitivity. Shown are pyruvate tolerance tests (a), area under the curve (AUC) of PTT (b), fasting glucose levels (c), expression of gluconeogenic genes in liver tissues (d) of global Smad3 KO (n = 5) and WT (n = 8) mice fed with NC and HFD. e, Western blotting analysis of PEPCK and G6Pase in livers of HFD-fed WT and KO mice. f and g, insulin signaling mediators, i.e. p-Akt, total Akt, p-ERK1/2, total ERK1/2, p-IRS1, and total-IRS1, along with tubulin as an internal control in liver tissues of NC-fed (f) and HFD-fed (g) Smad3 WT and KO mice. Western blotting analyses were performed using pooled lysates (n = 5 mice/group). All values present here are averages, and error bars represent S.E. *, p = 0.05; and **, p = <0.01.

