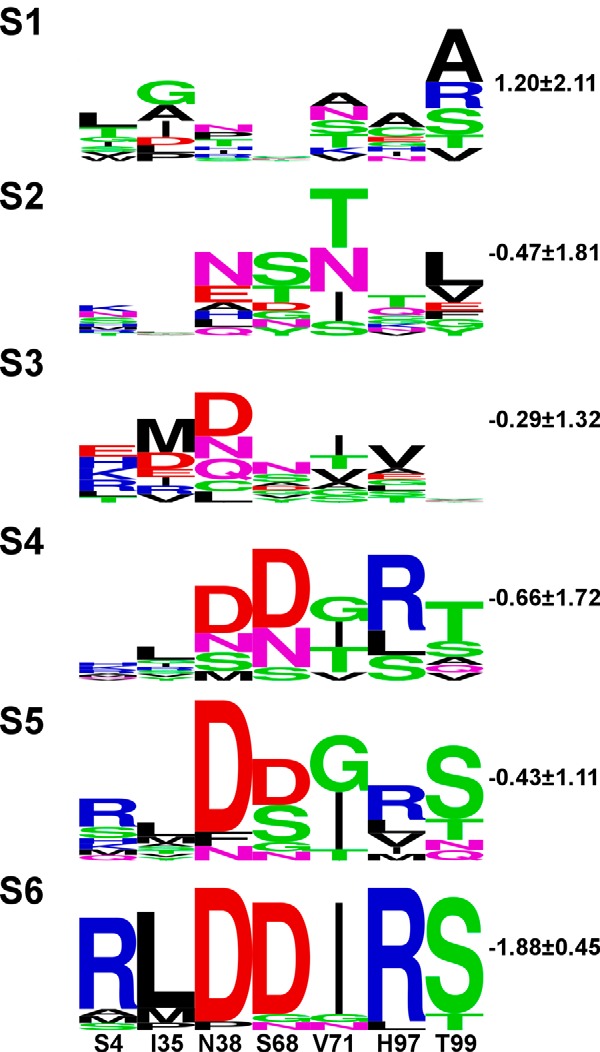
FIGURE 3.

Logo summaries of all N-TIMP2 clones sequenced after each selective round of sorting. The height of each letter is proportional to its frequency at that position. The total height of the stack represents conservation at that position. Green, purple, blue, red, and black letters, respectively, represent polar, neutral, basic, acidic, and hydrophobic amino acids. The identity and position numbers of N-TIMP2WT are denoted at the bottom of the figure. To the top left of each logo, numbers S1–S6 represent the sort number. To the right, the average ΔΔGbind value in kcal/mol is shown (see “Experimental Procedures” for calculation details). The logos were generated by the WebLogo sever.
