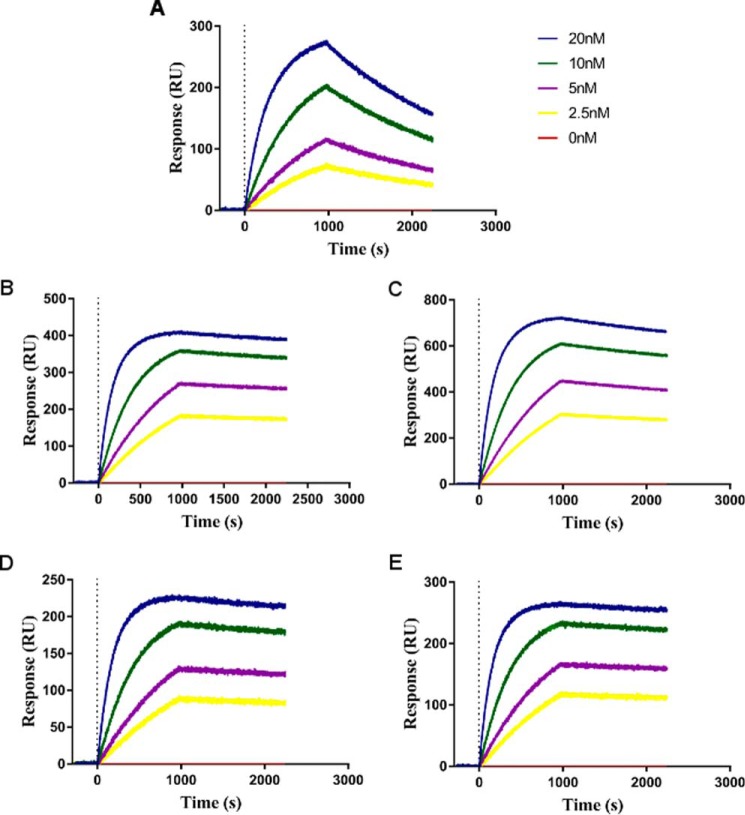
FIGURE 5.
SPR measurements of MMP-14CAT and N-TIMP2 variants interactions. A, N-TIMP2WT; B, N-TIMP2A; C, N-TIMP2B; D, N-TIMP2C; E, N-TIMP2D. The binding response (y axis) was measured for MMP-14CAT at different concentrations, 20 nm (blue), 10 nm (green), 5 nm (purple), 2.5 nm (yellow), and 0 nm (red).

