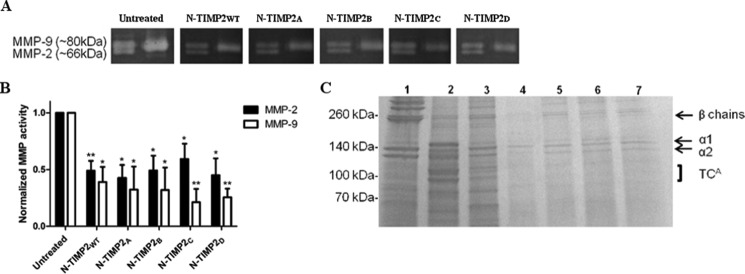
FIGURE 6.
Inhibition of gelatin and collagen degradation by N-TIMP2 variants. A, representative gelatin zymography of 1 nm MMP-2 and MMP-9 full-length proteins resolved on SDS-PAGE and treated with 100 nm N-TIMP2 inhibitors. Left lane of each gel represents pro-MMP2 (upper) and active MMP-2 (lower), and the right lane represents active MMP-9. B, quantification of band intensity normalized to the intensity of the control (untreated) gel. The average values for the percentage of inhibition for MMP2 are as follows: N-TIMP2WT, 51%; N-TIMP2A, 57%; N-TIMP2B, 51%; N-TIMP2C, 41%; N-TIMP2D, 55%; and for MMP9 as follows: N-TIMP2WT, 61%; N-TIMP2A, 68%; N-TIMP2B, 68%; N-TIMP2C, 79%; N-TIMP2D, 74%. Error bars represent S.E. Statistical analysis was performed by Student's t test compared with untreated control *, p < 0.05; **, p < 0.01 n = 3. C, representative degradation products of bovine type I collagen. Collagen (1.5 μg) was incubated with (lane 2) or without (lane 1) 2.2 μg of MMP-14CAT, or with 2.2 μg of MMP-14CAT along with 2.5 μm of inhibitors (N-TIMP2WT, N-TIMP2A, N-TIMP2B, N-TIMP2C, and N-TIMP2D, lanes 3–7, respectively). The labels α1 and α2 indicate the α1(I) and α2(I) chains of type I collagen, and the β chains indicate the cross-link between two α1 chains or between α1 chain and α2 chain. The ¾ cleavage product of type I collagen by MMP-14CAT is indicated as TCA (¾) fragment. Note the reduction in collagen degradation in the presence of the N-TIMP2 variants.

