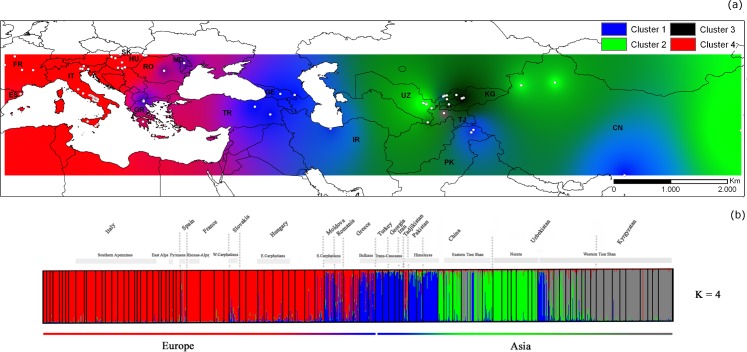
Fig 2. Spatial genetic structure of 91 walnut populations in Eurasia.
Population structure inference for 91 walnut populations by Bayesian assignment using STRUCTURE for K = 4. Synthetic map of Inverse Distance Weighted (IDW) interpolations of the estimated mean population membership values (Qi) (a) and bar plot showing assignment probabilities of individuals to K clusters (b). Abbreviations: CN = China, UZ = Uzbekistan, KG = Kyrgyzstan, TJ = Tajikistan, PK = Pakistan, IR = Iran, GE = Georgia, TR = Turkey, MD = Moldova, RO = Romania, HU = Hungary, SK = Slovakia, GR = Greece, IT = Italy, FR = France, ES = Spain.

