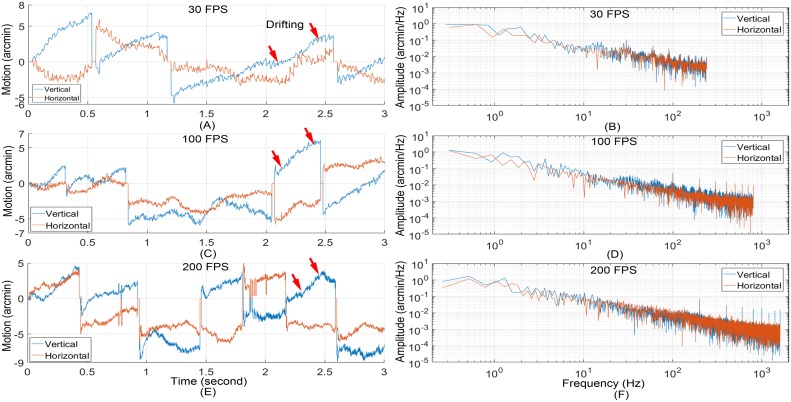
Fig 6. Retinal motion estimated with retinal images acquired at different frame rates.
(A) Retinal motion trace calculated from images acquired at 30 FPS. (B) Power spectra of motion amplitude of (A). (C) Retinal motion trace calculated from images acquired at 100 FPS. (D) Power spectra of (C). Retinal motion trace calculated from images acquired at 200 FPS. (F) Power spectra of motion amplitude of (E). Red arrows indicate exemplary drifting motion periods.

