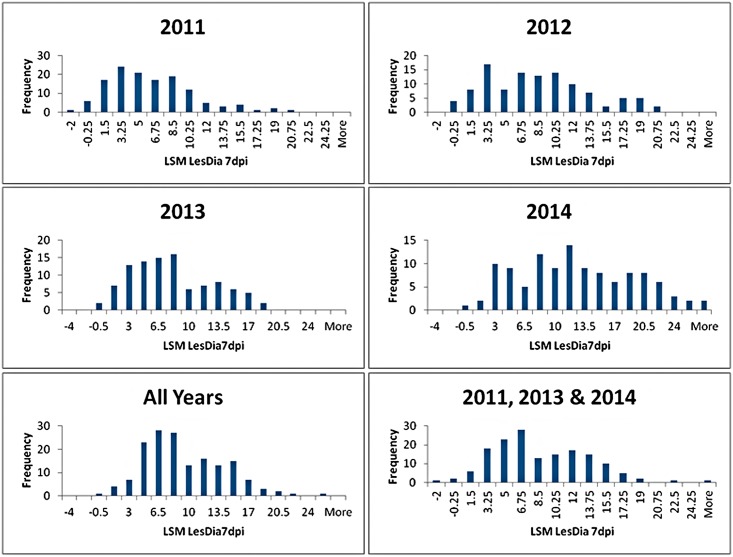
Fig 2. Histograms illustrating the frequency distribution of blue mold resistance within the GMAL4593 mapping population in multiple years.
Resistance measure was the least square (LS)mean of blue mold lesion diameter 7 days post-inoculation (LSM LesDia 7dpi in figure) of a uniform, fruit-surface wound with P. expansum calculated from a mixed linear model in which accession and fruit starch content were fixed-effects parameters, and fruit harvest date and specific blue mold evaluation test were random-effects parameters.

