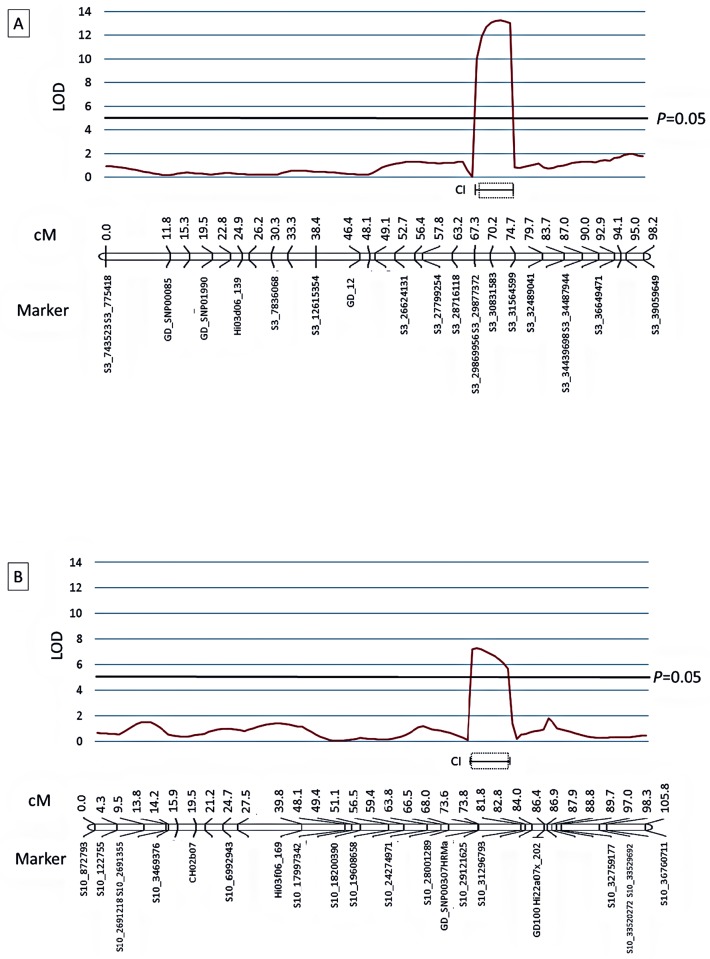
Fig 6. Localization of QTLs for resistance to P. expansum identified in the GMAL4593 (‘Royal Gala’ X PI613981) mapping population.
A: qM-Pe3.1 on linkage group 3 and B: qM-Pe10.1 on linkage group 10. The red line trace shows the LOD score determined by multiple QTL modeling using MapQTL6 (Kyazma B.V., Wageningen, The Netherlands). The genome wide P = 0.05 threshold for the data set was determined to be LOD = 4.4. The genetic linkage maps are in centiMorgans (cM) and were calculated using JoinMap 4.1 software (Kyazma B.V.). “CI” shows the 90% (solid bracket) and 95% (dashed line box) confidence intervals of the QTLs based upon a LOD support interval method. QTL nomenclature was based on international Rosaceae standards [55].

