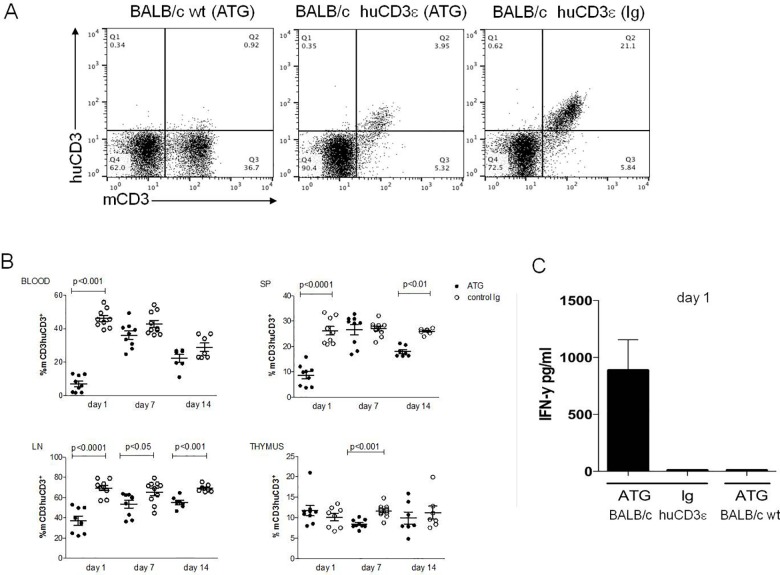
Fig 2. Depletion of T cells after ATG treatment.
BALB/c wt or BALB/c huCD3Ɛ were injected i.v with ATG or control rabbit Ig. Cells were stained with anti-human and anti-mouse CD3 mAbs and depletion of T cells was assessed by FACS in blood, spleen (SP), lymph nodes (LN) and thymus at the given time points. (A) Representative FACS plots of stained splenocytes. (B) Dot plots showing mCD3 and huCD3 staining as % lymphocyte. Six to nine mice per group (each data point represents an individual mouse), 2–3 independent experiments were performed. Mann-Whitney statistical test was used. Data are shown as means ± SEM. C. Serum IFN-ɣ levels after injection of ATG were measured by ELISA, 3–6 mice are shown.

