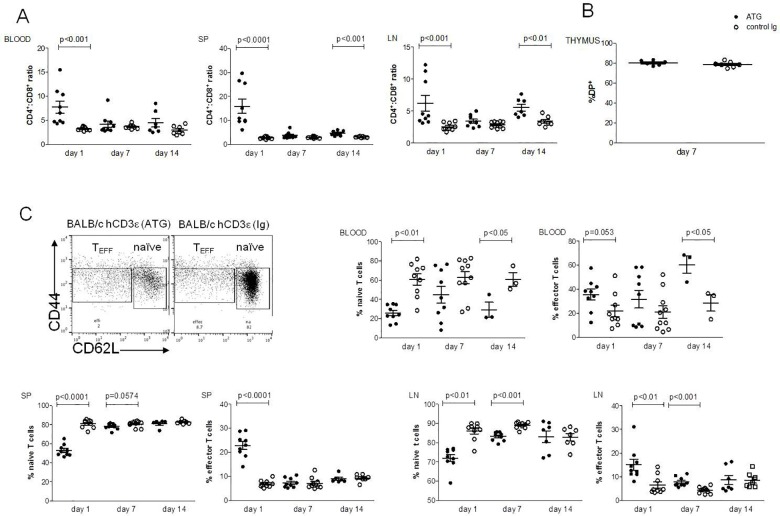
Fig 3. Depletion of T cell subsets after ATG treatment.
BALB/c huCD3Ɛ were injected i.v with ATG or control rabbit Ig. Cells were stained and depletion of T cells was assessed by FACS in blood, spleen (SP), lymph nodes (LN) and thymus, at the given time points. (A) Cells were gated on huCD3+ cells, and CD4:CD8 ratios are shown in different organs. (B) CD4+CD8+ double positive (DP), T cells in the thymus, shown as % lymphocytes. (C) Cells were gated on CD4+ cells, and naïve and effector T cells were determined and shown as % CD4+. Six to nine mice per group (each data point represents an individual mouse), 2–3 independent experiments were performed. Data are shown as means ± SEM. Mann-Whitney statistical test was used.

