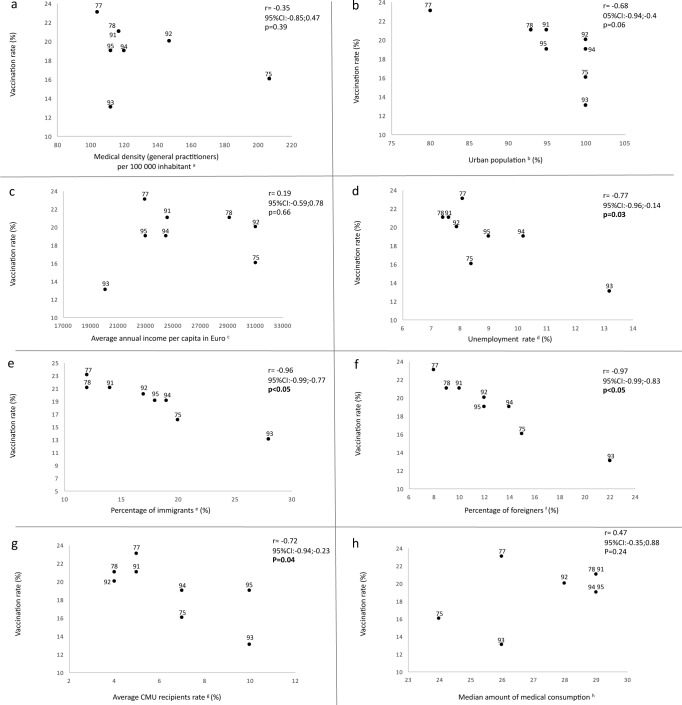
Fig 4.
Correlations between the vaccination rate (initiation) in each of the 8 departments and the medical density (a), urbanization rate (b), average incomes per capita (c), unemployment rate (d), percentage of immigrants (e), percentage of foreigners (f), average CMU recipient rates (g) and median amount of medical consumption from 2011 to 2013 (h). Each dot corresponds to a department. a. Data from the French National Medical Council (7). b. Data from the SENAT (8). c. Data from INSEE (9). d. Data from INSEE (10). e. Data from INSEE (11). f. Data from INSEE (12). g. Date from CMU (13). h. Data from our database.

