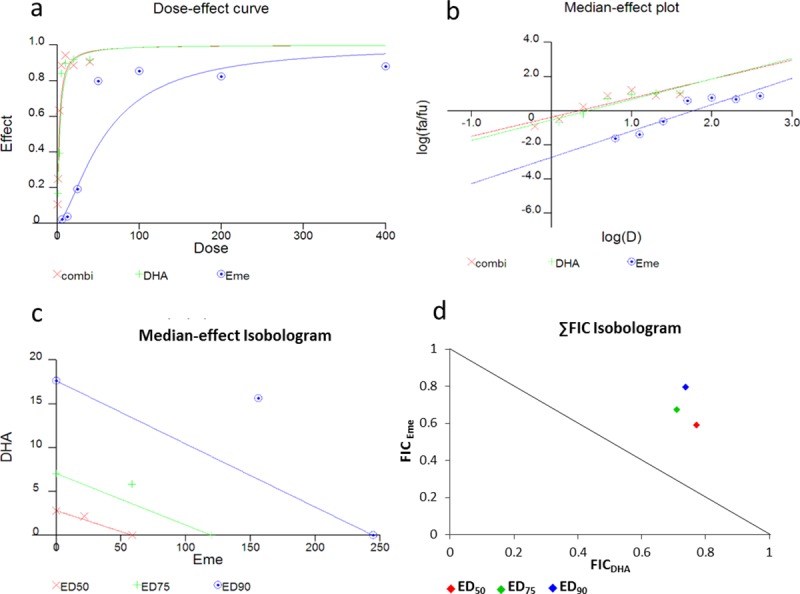
Fig 2. Comparison of dose-effect and FIC analysis for the dihydroartemisinin-emetine constant-ratio combination.

Parasites were treated with a dose series of chloroquine, emetine and the combination. Dose ranges for individual and combined drugs were completed in triplicate. Dose-effect analysis was completed in accordance with Chou Talalay method using CalcuSyn. An isobologram was also prepared manually from the same, constant-ratio (ED50: ED50), dose-response data based on ∑FIC analysis. The dose-effect curve (a), the median-effect plot (b) and the isobologram (c) from the CalcuSyn output are shown alongside the FIC isobologram (d) For the ED50 ED75 and ED90 levels of inhibition.
