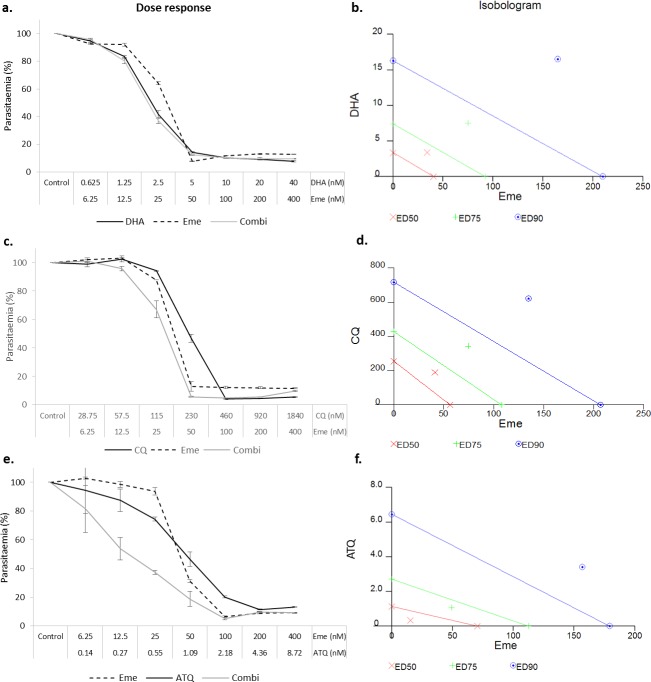
Fig 6.
The constant ratio combinations of dihydroartemisinin-emetine (a,b), chloroquine-emetine (c,d) and atovaquone-emetine (e,f) using CalcuSyn. Parasite viability was analysed after 72 hours using the SG-FCM method. A basic dose-response curve is shown as well as the isobolograms to indicate the nature of the interaction for each constant-ratio (based on a 2-fold dose series where respective drug ED50: ED50 doses serveed as the midpoint) combination at the ED50 ED75 and ED90 effect levels (Marker below the line = synergistic, on the line = additive and above the line antagonistic). The degree of the classification is indicated by the distance of the marker from the respective (colour coded) line.

