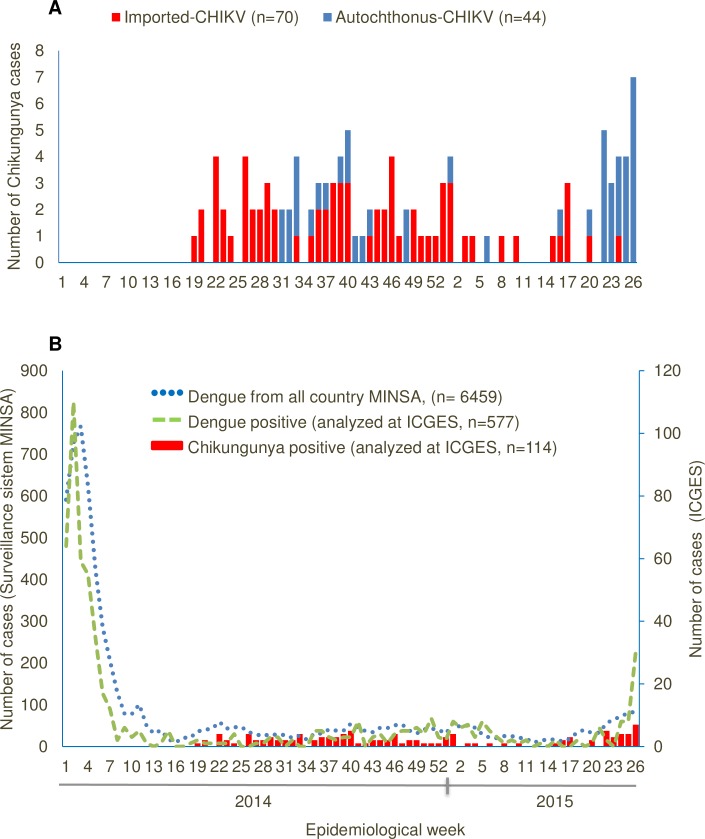
Fig 2. Epidemic curve of chikungunya and dengue cases reported in Panama country from 2014 to July 2015.
A. Red bar represents Chikungunya imported cases and blue bar autochthonous cases. B. Blue dots represent dengue positive cases in the country of Panama from the National Dengue surveillance program (left axis). From this surveillance ICGES detected ~10% (577/6459) of the national dengue positive cases (green broken line, right axis). All the positive Chikungunya cases (red bar, right axis) from the National Chikungunya Surveillance program were analyzed at ICGES.

