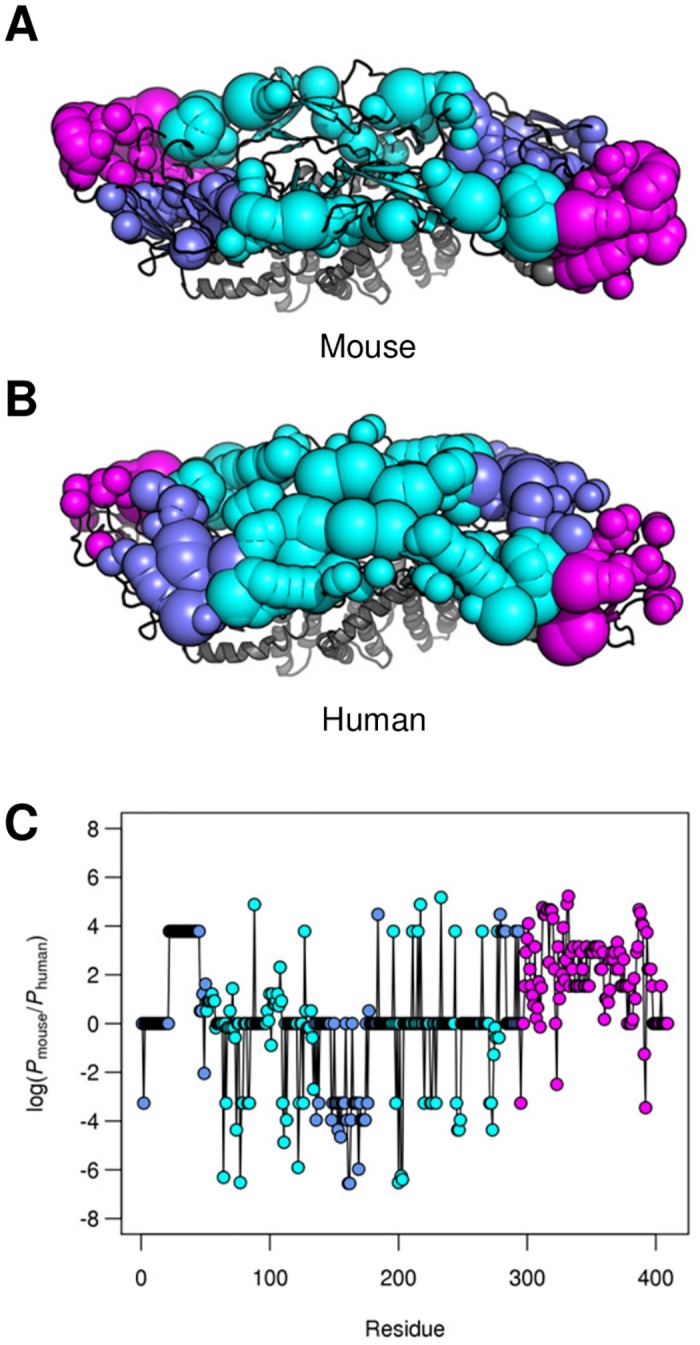
Fig 4. Differences in epitope fine-specificity between mouse and human.

Mapping of epitope propensity on to the structure of the DENV E protein dimer for mAbs from mouse (A) and human (B). Spheres correspond to epitope residues. The size of the sphere corresponds to its epitope propensity, as described previously. C. Difference in epitope propensity between mouse and human across the E protein. Residue color corresponds to domain—purple, cyan, and magenta, for DI, DII, and DIII, respectively.
