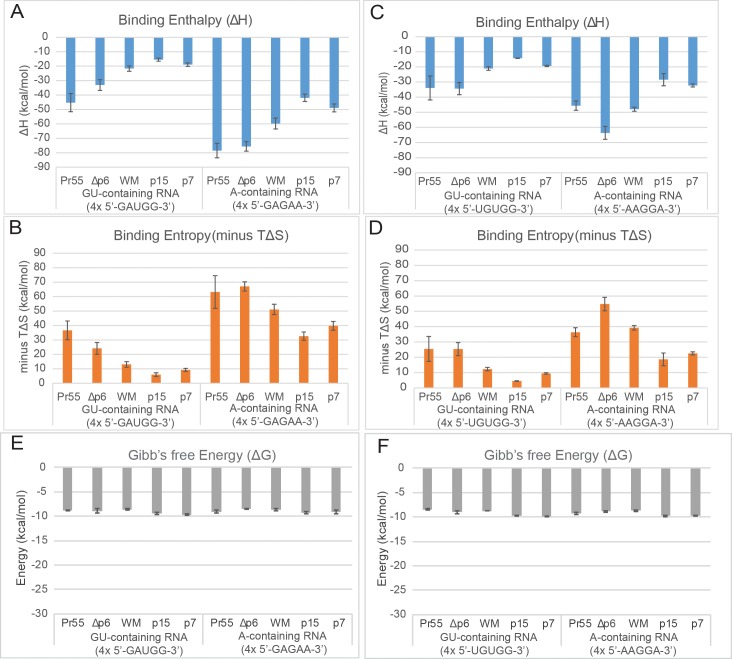
Fig 3. ITC analysis of Gag-RNA binding show more energetically favourable binding enthalpies and larger unfavourable entropy of Gag to A-containing over GU-containing RNA.
Calculated (A) binding enthalpy, (B) binding entropy and (E) Gibb’s Free Energy from ITC binding curves fitted to a one-site interaction model plotted for replicate Gag protein interactions with first set of 20mers GU-containing RNA (4x 5’-GAUGG-3’) and A-containing RNA (4x 5’-GAGAA-3’) (n = 3). Calculated (C) binding enthalpy and (D) binding entropy and (F) Gibb’s Free Energy from ITC binding curves with second set of 20mers GU-containing (4x 5’-UGUGG-3’) and A-containing RNA (4x 5’-AAGGA-3’) (n = 2). The mean value is plotted and the error bars represent the SEM.

