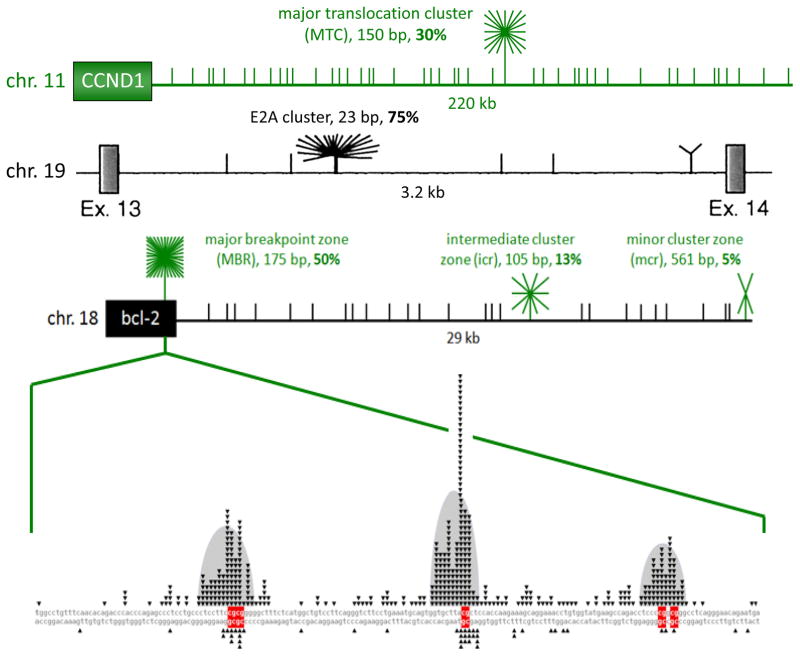
Figure 3. A High Proportion of Breakpoints on BCL-2, BCL-1, and E2A Fall into Fragile Regions that are Less than 600 bp.
Schematics of the BCL-1 [near CCND1 gene], E2A (also called TCF3), and BCL-2 regions illustrate clustering of breakpoints within the various identified cluster regions [green or black starbursts]. The breakpoints that do not fall into cluster regions are plotted randomly for illustrative purposes [short vertical lines]. In the top line (green horizontal line), the MTC is located about 110 kb from the gene for the cyclin D1 oncoprotein. The 150 bp MTC contains about 30% of breakpoints, whereas the remaining 70% of events are distributed widely over the surrounding 340 kb as recently mapped and sequenced 14. The second line shows a diagram of intron 13 of the E2A gene, taken from 84, which showed that 75% of breakpoints occur in the 23 bp E2A cluster, while the surrounding 3 kb only account for 25%. The third line depicts relative proportions of breakpoints at the BCL-2 MBR, icr, and mcr cluster regions. The third exon of the BCL-2 gene, black box on left, contains the MBR [major breakpoint region (or zone)] within the 3′ UTR region, while the centromeric 29 kb contains the icr (intermediate cluster region/zone) and mcr (minor cluster region/zone). Short vertical lines in the gene diagram mark the approximate locations and relative abundance of patient breakpoints. The 175 bp MBR, 105 bp icr, and 561 bp mcr account for about 50%, 13%, and 5% of bcl-2 translocation breakpoints. Every CG sequence motif in each of the three fragile zones the ~29kb downstream of the BCL-2 gene (MBR, icr, mcr) is a hotspot for human translocation. The figure shows the location of nearly all published BCL-2 translocations with expanded detail of the MBR in the very bottom line of the figure. Fragile regions or zone for one of the oncogenes in this review, BCL-2, are shown, but the principles apply to the other fragile zones as well. Within each fragile zone, the actual translocations occur at DNA sequence motifs, consisting of either the sequence CG (CpG) or mCG (when methylated) or WGCW where W=A or T. Human lymphomas are clinically indistinguishable regardless of the position of the breakpoint within the 29 kb. We are trying to determine why these BCL-2 and related zones at other loci (such as BCL-1, MTC, E2A, MALT1, and CRLF2) are highly preferred for DNA breakage and translocation. In the expanded MBR DNA sequence diagram (bottom line of figure), each small black triangle marks the breakpoint of a single, patient translocation. The breakage frequency within this 175 bp region is 300-fold higher than what one would expect to occur at random. Patient breaks within the MBR are not uniformly distributed across the entire 175 bp, but rather are focused in 3 peaks (bell-shaped gray areas), and there are CG sequence motifs (red bases) located near the center of each peak 1. The p values for the proximity of the MBR breaks to CG sites are between 10−42 and 10−96 (highly significant). The importance of CG and WGCW as translocation sequence motifs applies not only to the BCL-2 gene, but also to most other human B cell neoplastic chromosomal translocations. For example, breaks at the major translocation cluster (MTC) of the BCL-1 gene are also located near CG sites (p values of 10−9 to 10−13), and breaks on the telomeric side of the MTC are significantly near WGCW sites. In the MALT1 gene translocations to IgH in human MALT lymphomas (Fig. 2B), the breaks are also located at CG sites (p = 0.002). The proximity of CG to breaks applies also to the E2A gene translocations (p = 10−4) and the CRLF2 gene translocations to IgH (p = 0.0004) in human pre-B ALL.

