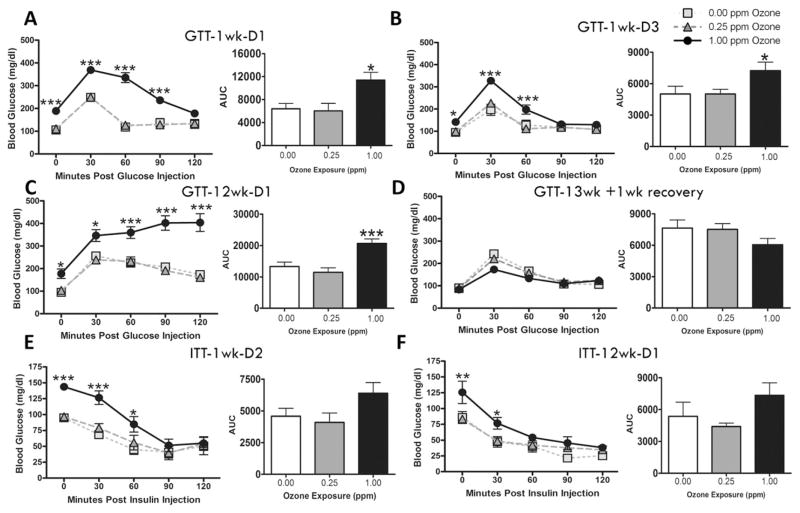
Fig. 2.
Acute and subchronic ozone exposures induce hyperglycemia and glucose intolerance without impairing insulin tolerance. GTT was conducted in animals at (A) week 1, day 1 (1 wk-D1), (B) week 1, day 3 (1 wk-D3), (C) week 12, day 1 (12 wk-D1), and (D) six days after the 13 wk final exposure (13 wk + 1 wk recovery). ITT was conducted at (E) week 1, day 2 (1 wk-D2) and (F) week 12, day 1 (12 wk-D1). Bar graphs show respective area under the curve (AUC) values for each test. Values indicate mean ± SEM (n = 8–10). *Indicates ozone effect when compared to matching air group (*p < 0.05, *p < 0.01, ***p < 0.001).

